
OCR Specification focus:
‘Identify anomalies in experimental measurements and suggest reasons for their occurrence or exclusion.’
Identifying Anomalies
Experimental data rarely follows an exact pattern due to measurement uncertainty, equipment limitations, or random human error. Understanding and identifying anomalies is essential for evaluating the validity and reliability of results in OCR A-Level Chemistry practical work.
This section explores how anomalies are detected, justified, and treated in chemical experiments to ensure accurate and defensible scientific conclusions.
Understanding Anomalies
An anomaly is a data point that deviates significantly from the expected trend or pattern of results. It does not fit with the rest of the data and cannot be explained by normal variation or uncertainty.
Anomaly: A result that falls outside the expected pattern of data and is inconsistent with other repeated measurements.
Anomalies are important indicators of potential experimental errors, equipment malfunction, or environmental factors influencing the data. Recognising them helps chemists improve their methods and refine experimental design.
Causes of Anomalies
Random Errors
Random errors are unpredictable variations that occur when measurements fluctuate due to small, uncontrollable factors. They affect the precision of results rather than their accuracy.
Common causes include:
Reading errors on analogue scales
Variations in temperature or pressure
Minor inconsistencies in sample size or reagent concentration
Human timing errors in rate experiments
Systematic Errors
Systematic errors produce a consistent deviation in one direction and affect accuracy. While they shift all data away from the true value, they may also produce results that appear as anomalies if they disproportionately affect individual readings.
Sources of systematic error include:
Incorrectly calibrated instruments
Consistent parallax errors
Contaminated reagents
Faulty experimental setup
Blunders or Gross Errors
Gross errors are significant mistakes, often due to human error. These typically produce clear outliers far from the rest of the data.
Examples include:
Misreading a burette by 1 cm³
Using the wrong chemical concentration
Recording data incorrectly
Detecting Anomalies
To determine whether a result is anomalous, chemists use a combination of graphical, statistical, and comparative methods.
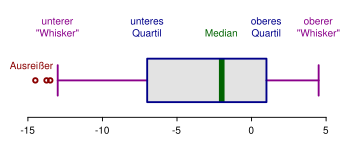
Annotated box-and-whisker plot showing median, quartiles, whiskers, and outlier markers. Outliers fall beyond the whiskers, helping you quickly spot anomalous values for further checking. Note: this diagram also labels quartiles (extra context beyond the OCR wording but standard for outlier identification). Source
Visual Inspection of Graphs
When plotting data, anomalies often appear as points far from the line of best fit. Consistent patterns suggest good reliability, whereas isolated points away from the line may indicate experimental issues.
Key checks include:
Consistency of gradient and intercept
Alignment of data with theoretical expectations
Distance from trend line compared to other data points
Statistical Comparison
Numerical methods can strengthen anomaly identification:
Mean and range: If a value lies far outside the range of repeats, it may be anomalous.
Standard deviation: Results more than two standard deviations from the mean can be classed as anomalous.
Standard Deviation: A measure of the spread of data around the mean, used to identify consistency and detect outliers.
Comparison with Repeats
Repeating measurements helps confirm the reliability of data. A single measurement that disagrees significantly with repeats is likely to be an anomaly. Consistent results suggest high repeatability, whereas inconsistent ones warrant review of experimental conditions.
Assessing Anomalies
Once identified, the next step is to evaluate whether the anomalous data should be excluded, repeated, or retained with explanation.
Factors to Consider
When deciding how to handle anomalies, students should assess:
Whether there is a clear procedural reason for the deviation
Whether the anomaly is supported or contradicted by theoretical expectations
The magnitude of the difference compared with uncertainty ranges
Whether removing it significantly alters the overall trend
Exclusion Criteria
Anomalies may be excluded from final analysis if:
They result from an identified procedural or instrumental error
They are statistically inconsistent with other measurements
They distort the calculated mean beyond acceptable uncertainty
However, results must never be excluded without justification. Students should always provide reasoning for their decision in written evaluation.
Explaining Anomalies
In OCR A-Level Chemistry, credit is given for linking anomalies to chemical reasoning or experimental design flaws. Possible explanations include:
Incomplete reaction: Reaction mixture not fully mixed or insufficient time allowed.
Temperature fluctuations: Affecting reaction rates or equilibrium positions.
Contaminated apparatus: Introducing unwanted side reactions.
Instrument drift: Gradual change in calibration during measurements.
Human error: Incorrect timing or reading of instruments.
When explaining anomalies, use concise, evidence-based statements linking the observed deviation to a plausible cause within the experimental setup.
Treating Anomalies in Data Analysis
Including Anomalies in Graphs
All data points, including anomalies, should be plotted to maintain transparency. The anomalous point may be highlighted or circled to indicate that it has been recognised.
Repeating Measurements
If time and resources permit, repeat measurements should be conducted to confirm whether the anomaly was a one-off occurrence or part of a pattern.
Reporting Anomalies
In formal write-ups:
Clearly state any anomalies observed
Provide justification for exclusion or retention
Explain how the anomaly affects final results or conclusions
This practice strengthens the validity of conclusions and aligns with scientific integrity.
Link to Reliability and Validity
Identifying anomalies is directly tied to assessing reliability, repeatability, and reproducibility — core aspects of scientific investigation.
Reliability: The consistency of a set of results obtained under identical conditions.
Repeatability: The ability to obtain the same result when the experiment is performed multiple times by the same person.
Reproducibility: The ability to obtain the same result when different people or equipment are used.
Correct handling of anomalies ensures that conclusions drawn are both valid (based on accurate interpretation of evidence) and reliable (supported by consistent data).
Summary of Key Actions When Identifying Anomalies
Recognise data points that deviate from the trend.
Compare with repeats, calculate deviations, and use graphs or statistics.
Identify possible causes — random, systematic, or gross errors.
Provide chemical or procedural explanations for each anomaly.
Justify any decision to exclude or retain anomalous data.
Maintain transparency by reporting all findings clearly.
Effective identification and interpretation of anomalies demonstrate strong analytical skills and ensure that conclusions in A-Level Chemistry investigations are both scientifically sound and defensible.
Practice Questions
A student conducts an experiment measuring the rate of a reaction at different temperatures. One of the recorded data points lies far from the line of best fit on the plotted graph.
(a) Identify what this data point is called and state one possible reason for its occurrence.
(2 marks)
1 mark for identifying the data point as an anomaly or anomalous result.
1 mark for a correct reason, e.g. measurement error, incorrect temperature, contamination of sample, or misreading of apparatus.
During an investigation into the enthalpy change of a neutralisation reaction, a student identifies one temperature reading that is significantly lower than the others. The student decides to exclude this result from their calculations.
(a) Explain how the student could determine that this reading is anomalous. (2 marks)
(b) Suggest two possible causes of this anomaly. (2 marks)
(c) Explain why it is important to justify the exclusion of any anomalous data in a written report. (1 mark)
(5 marks)
(a)
1 mark for stating that the result does not fit the general trend or pattern of data.
1 mark for mentioning use of graphical analysis (e.g. point far from line of best fit) or statistical methods (e.g. outside expected range or more than two standard deviations from mean).
(b)
1 mark for each valid reason, such as loss of heat to surroundings, incorrect thermometer reading, insufficient mixing, or equipment fault.
(c)
1 mark for stating that justification ensures scientific validity, transparency, and reliability of results or conclusions.
FAQ
An anomalous result is a measurement that doesn’t fit the overall pattern or trend in a dataset and is suspected to be caused by error or unexpected factors.
An outlier, on the other hand, is a statistically distant value that may or may not be anomalous—it could reflect real variation rather than an error. Anomalies are therefore a subset of outliers that are scientifically unjustified within the experimental context.
Modern data analysis programs such as Excel, Logger Pro, or Python’s NumPy library can:
Automatically calculate means, ranges, and standard deviations.
Highlight points that deviate significantly from a line of best fit.
Apply outlier detection formulas (e.g. z-scores) to flag suspect values.
Using software increases accuracy in identifying anomalies but should always be supported by scientific reasoning.
Removing anomalies without justification can lead to biased conclusions. Some anomalies may indicate genuine scientific phenomena, such as unexpected reactions or equipment sensitivity.
Before exclusion, students must evaluate:
Whether the anomaly has a known procedural cause.
If it aligns with theoretical understanding.
Whether its removal affects the overall trend significantly.
Repeating experiments verifies whether an anomalous value is a one-time error or a consistent trend. If the anomaly persists under identical conditions, it may represent a real scientific effect.
Repeats help confirm:
Reliability: ensuring consistent outcomes under the same setup.
Reproducibility: confirming results when performed by others using similar methods.
Error identification: distinguishing human mistakes from genuine variability.
Calibration errors cause instruments to give consistently incorrect readings, which can lead to one or more data points appearing anomalous. For example:
A miscalibrated balance may record slightly incorrect masses.
A pH meter not zeroed properly might skew readings by a fixed amount.
Such errors introduce systematic deviation, which may make isolated results appear anomalous even though the issue is procedural rather than random.
