
OCR Specification focus:
‘Discuss precision and accuracy, including margins of error, percentage errors and uncertainties associated with apparatus and technique.’
Introduction
In experimental chemistry, understanding precision, accuracy, and measurement error is essential for evaluating data quality and the validity of conclusions. These concepts underpin how reliable and trustworthy results are in both qualitative and quantitative investigations.
Understanding Precision and Accuracy
Precision
Precision describes the consistency or repeatability of measurements — how close repeated values are to each other under the same conditions.
High precision indicates that repeated measurements yield similar results, even if those results are not close to the true value.
Precision: The degree to which repeated measurements under unchanged conditions show the same results.
Factors affecting precision include:
Instrument resolution – finer measurement intervals allow greater precision.
Consistency of experimental conditions – temperature, pressure, and timing must be stable.
Human technique – consistency in method and observation reduces variability.
Accuracy
Accuracy refers to how close a measurement is to the true or accepted value.
A measurement can be precise but inaccurate if systematic errors cause all readings to deviate in the same direction.
Accuracy: The closeness of a measured value to the true or accepted reference value.
To ensure accuracy:
Calibrate instruments correctly before use.
Minimise systematic errors from apparatus or environmental factors.
Use appropriate analytical techniques suited to the chemical system studied.
Relationship Between Precision and Accuracy
Precision and accuracy are related but distinct. A set of results can:
Be precise but not accurate – consistent results far from the true value.
Be accurate but not precise – results average near the true value but vary widely.
Be both precise and accurate – consistent results that are close to the true value.
Visualising these concepts as a target diagram helps:
Precision = clustering of hits.
Accuracy = closeness to the bullseye.

Target diagrams illustrating four combinations of accuracy and precision. Accurate measurements cluster near the true value; precise measurements cluster tightly, regardless of location. The optimal outcome is both accurate and precise. Source
Types of Measurement Error
Measurement errors arise when recorded values differ from the true value. Errors can be random or systematic.
Random Errors
These cause unpredictable fluctuations in measured values, making them spread around a mean. They affect precision rather than accuracy.
Common sources:
Reading errors in burettes or thermometers.
Slight temperature or pressure fluctuations.
Human reaction time in timing experiments.
To reduce random errors:
Repeat measurements and calculate a mean value.
Use apparatus with finer scales.
Maintain consistent experimental conditions.
Systematic Errors
These cause measurements to be consistently higher or lower than the true value, affecting accuracy.
Common sources:
Incorrect calibration of instruments.
Parallax errors from misreading scales.
Loss of substance during transfer or incomplete reaction.
To reduce systematic errors:
Calibrate apparatus using standard references.
Follow standardised procedures.
Use control experiments where possible.
Quantifying Uncertainty
All measurements carry a degree of uncertainty, which must be estimated and expressed.
Uncertainty: The range within which the true value of a measurement is expected to lie.
Absolute and Percentage Uncertainty
Uncertainty can be expressed as:
Absolute uncertainty – the ± value representing the measurement range (e.g., ±0.1 cm³).
Percentage uncertainty – compares the uncertainty to the measured value.
Percentage uncertainty (%) = (Absolute uncertainty ÷ Measured value) × 100
Absolute uncertainty = The instrument error margin (same unit as measurement)
Measured value = The recorded experimental value (same unit)
Guidelines:
Record uncertainties to the same number of decimal places as the measured value.
For analytical balances, use manufacturer specifications to determine uncertainty (e.g., ±0.0001 g).
When combining measurements:
For addition or subtraction, add absolute uncertainties.
For multiplication or division, add percentage uncertainties.
Margins of Error and Percentage Error
The margin of error expresses the acceptable range around a measurement or calculated value.
In chemistry, percentage error is often used to assess how close an experimental value is to a known theoretical value.
Percentage error (%) = [(Experimental value – True value) ÷ True value] × 100
Experimental value = The measured or calculated result
True value = The accepted or theoretical value
Interpretation:
A small percentage error suggests good accuracy.
A large percentage error may indicate systematic issues in method or apparatus.
Uncertainty from Apparatus and Technique
Each piece of apparatus contributes to the total uncertainty in an experiment.
Typical sources:
Burette: ±0.05 cm³, uncertainty doubled when measuring titre differences.
Pipette: ±0.03 cm³ for standard 25.00 cm³ volume.
Balance: ±0.001 g or ±0.0001 g depending on precision.
When evaluating methods, consider:
Whether the chosen apparatus matches the required precision.
If the smallest measurable unit is appropriate for the scale of change observed.
Whether repeated trials help reduce uncertainty through averaging.
Proper technique also influences uncertainty:
Reading at eye level avoids parallax error.
Rinsing apparatus with the correct solution ensures accurate concentrations.
Avoiding loss of material during transfer maintains reliability.
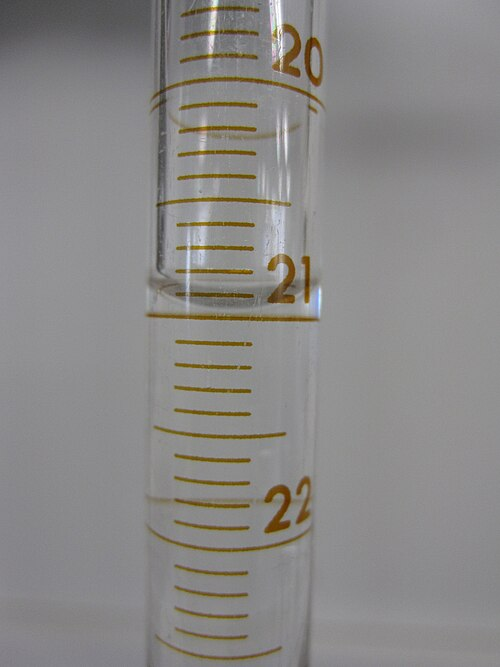
Burette meniscus with the reading taken at the lowest point of the concave meniscus. Viewing at eye level minimises parallax error and improves precision. This visual directly supports correct volume readings for titrations and other volumetric work. Source
Evaluating Data Quality
To assess data quality:
Compare percentage uncertainty to the size of measured change.
If uncertainty > measured change, the result is unreliable.
Evaluate both precision (spread of repeats) and accuracy (closeness to true value).
Consider whether improvements could reduce uncertainty, such as using higher-resolution equipment.
Key evaluative points:
High precision alone does not confirm accuracy.
Low uncertainty improves confidence in results.
Recognising sources of error and uncertainty ensures better interpretation of experimental data.
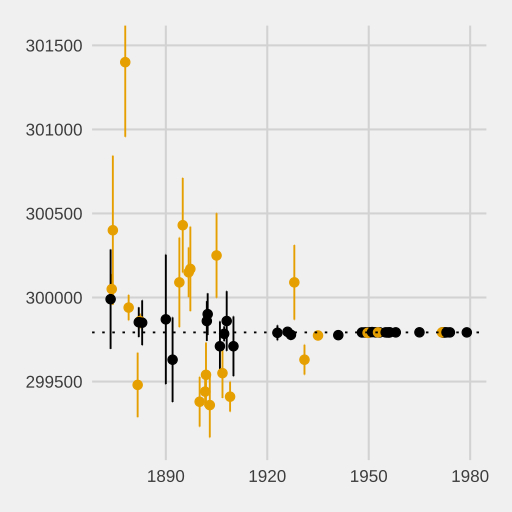
A time-series plot with points and vertical error bars representing standard errors. Error bars visually convey the uncertainty of each estimate and help compare precision between results. Note: the specific dataset is from physics, but the error-bar convention is standard across sciences. Source
Practice Questions
Define the terms precision and accuracy in the context of experimental measurements. (2 marks)
1 mark for correctly defining precision as the closeness or consistency of repeated measurements under the same conditions.
1 mark for correctly defining accuracy as the closeness of a measurement to the true or accepted value.
A student titrates a solution of hydrochloric acid with sodium hydroxide using a burette and records the following titres (cm³):
25.10, 25.15, 25.05, 25.50, 25.10.
(a) Identify any anomalous result. (1 mark)
(b) Calculate the mean titre, excluding the anomaly. Show your working. (2 marks)
(c) State one possible reason for the anomaly. (1 mark)
(d) Suggest one improvement to the experimental technique that could increase precision. (1 mark)
(5 marks)
(a) 1 mark: Identifies 25.50 cm³ as the anomalous result.
(b) 2 marks:
Correct exclusion of anomaly (uses 25.10, 25.15, 25.05, 25.10).
Correct calculation: (25.10 + 25.15 + 25.05 + 25.10) ÷ 4 = 25.10 cm³.
(c) 1 mark: States a valid reason for the anomaly, e.g. parallax error when reading the burette or air bubble in the jet.
(d) 1 mark: Suggests an improvement that increases precision, e.g. take more repeat titres and calculate a mean or use a burette with smaller graduations.
FAQ
Random uncertainty arises from unpredictable variations in measurements, such as small changes in temperature or observer reading error. It affects the precision of results and can be reduced by taking multiple readings and calculating a mean.
Systematic uncertainty is consistent and directional, often due to instrument calibration errors or procedural flaws. It affects the accuracy of results and cannot be reduced by repetition. Instead, it must be identified and corrected through calibration or method refinement.
When comparing two sets of data, if their uncertainty ranges overlap, it means the difference between them may not be significant.
To evaluate reliability:
Express results with their uncertainty (e.g. 24.6 ± 0.2 cm³).
Compare the ranges. If they overlap, the difference is not statistically meaningful.
Non-overlapping ranges suggest a genuine difference in the results.
Percentage uncertainties allow direct comparison between measurements of different magnitudes or units.
For example:
A ±0.1 cm uncertainty on a 1 cm measurement is 10%, but on a 10 cm measurement, it’s only 1%.
This shows that the same instrument may be suitable for one measurement but not another, depending on the required precision.
Percentage uncertainties make it easier to judge which experiment or apparatus provides more reliable and precise data.
The resolution of an instrument is the smallest detectable change it can measure. A finer resolution reduces absolute uncertainty.
For example:
A balance measuring to 0.001 g is more precise than one measuring to 0.1 g.
The uncertainty is typically half the smallest division on the scale.
Choosing instruments with higher resolution improves precision, though it may not eliminate systematic errors or guarantee higher accuracy.
Repeating measurements helps identify random errors and improves the reliability of data.
When multiple readings are taken:
Random fluctuations tend to cancel out.
The mean value becomes a better estimate of the true result.
The range or standard deviation can indicate the level of precision.
However, repeats do not correct systematic errors — those require better calibration or improved experimental design.
