
OCR Specification focus:
‘Use peak integration and external calibration curves to determine amounts and proportions of components.’
Introduction
Gas chromatography quantification allows chemists to measure how much of each component is present in a mixture by analysing peak areas, detector response, and calibration data effectively.
Understanding Quantification in Gas Chromatography
Quantification in gas chromatography (GC) involves determining the amount or proportion of each component in a mixture by analysing the chromatogram produced as compounds pass through a column and reach a detector. The height or area of each peak relates to the amount of substance reaching the detector, making GC a powerful tool for mixture analysis in organic and analytical chemistry.
In gas chromatography, quantification starts with the chromatogram (detector response against time), where each component appears as a distinct peak.
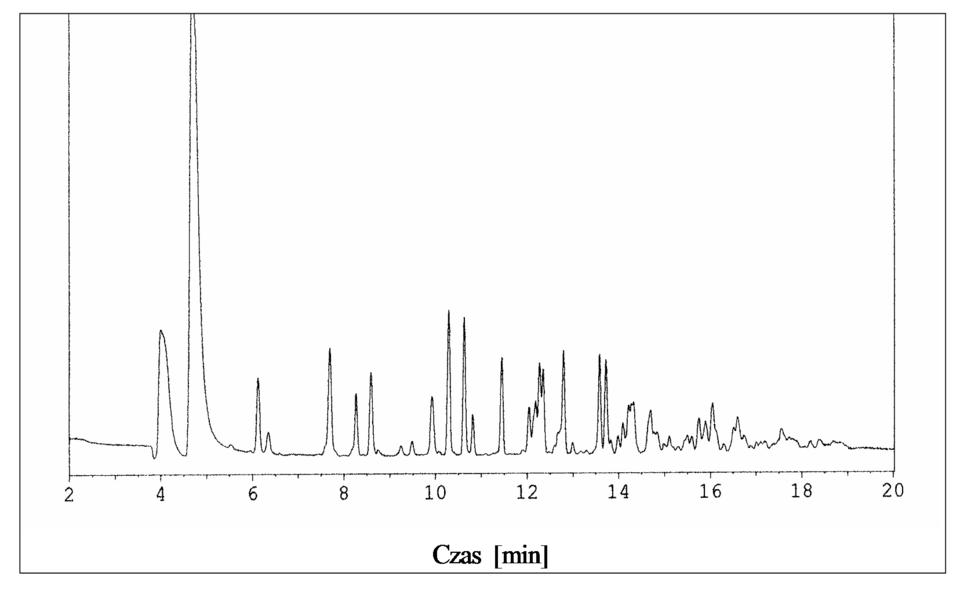
A gas chromatogram showing detector response against time, where each separated component produces a peak. In quantitative work, the peak area rather than peak height is used to determine the amount of each component. Source
When interpreting chromatograms, the central idea is that peak area is proportional to the quantity of analyte reaching the detector. The detector response must be calibrated before reliable numerical measurements can be made.
Peak Integration
Peak integration refers to the mathematical process of determining the area under each chromatographic peak, representing the detector's total response to each compound. Modern GC software calculates these areas automatically, but students should understand the principle that area, not height, provides the most reliable quantitative measure.
Quantification uses peak integration, where software calculates the area under each peak to give a detector response proportional to the amount of that component.
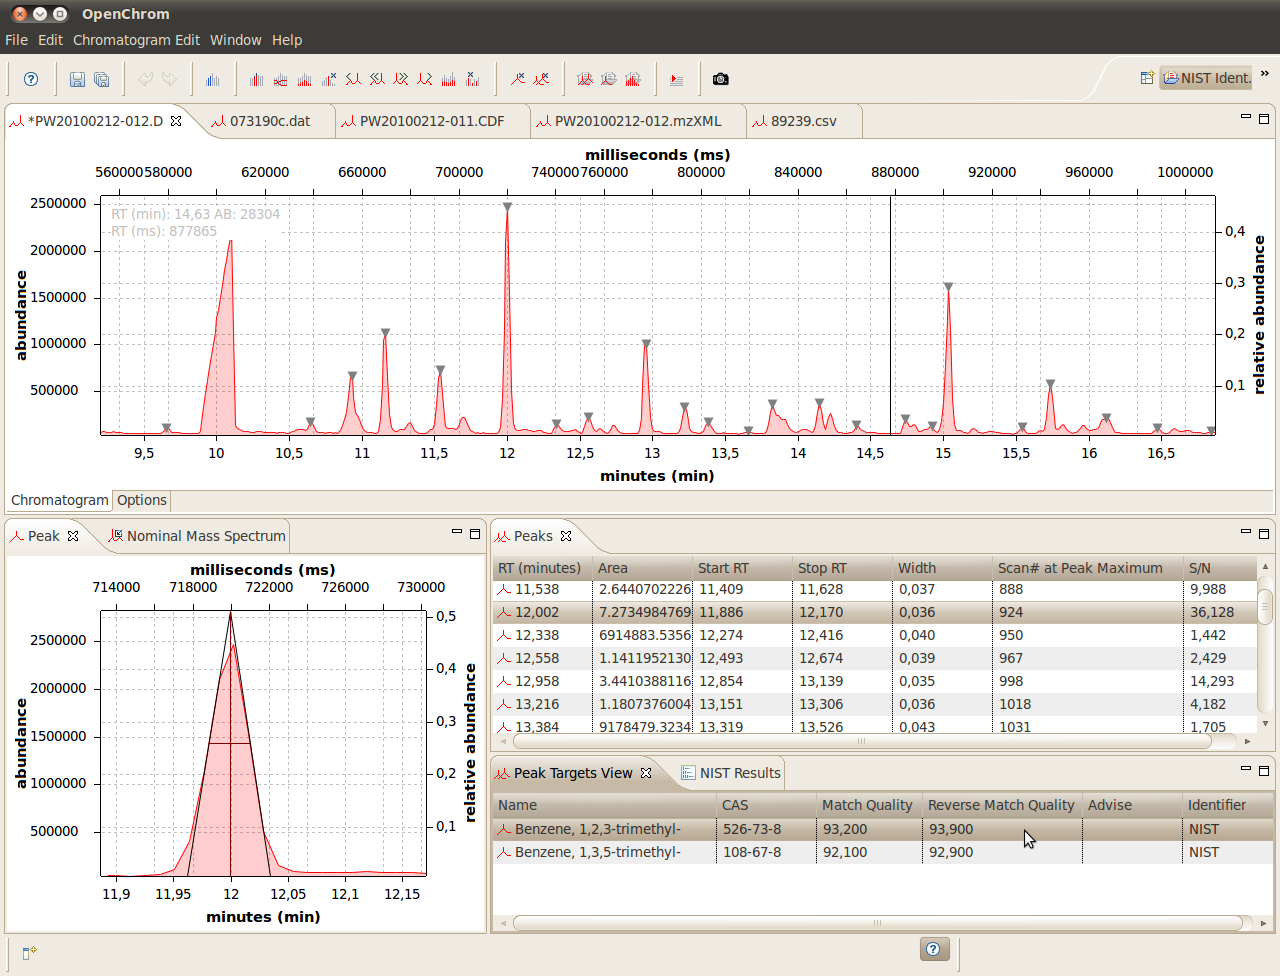
A chromatography software display illustrating peak integration, where the shaded area under the peak represents detector response. Additional tables and software details are shown but are not required by the OCR syllabus. Source
Bullet points help to illustrate the key ideas:
Peak area is proportional to the amount of analyte entering the detector.
Peak integration accounts for peak width, variation in peak shape, and detector sensitivity.
Baseline correction ensures that noise or drift does not inflate area values.
Integrated areas can be compared with those from known standards.
External Calibration
External calibration is essential for converting peak area values into quantitative measurements. A series of standard solutions of known concentration is used to construct a calibration curve plotting detector response (usually peak area) against concentration. The curve provides a linear relationship, allowing unknown sample concentrations to be determined.
Before expanding further, it is essential to introduce the formal definition of a calibration curve.
Calibration Curve: A plot of detector response against known analyte concentrations, used to determine the concentration of analytes in unknown samples.
A calibration curve allows accurate quantification by linking the peak area of an unknown sample directly to its concentration through the linear relationship obtained from standards.
External calibration uses a set of standards to plot peak area against concentration, producing a calibration curve that is used to convert sample peak areas into amounts.
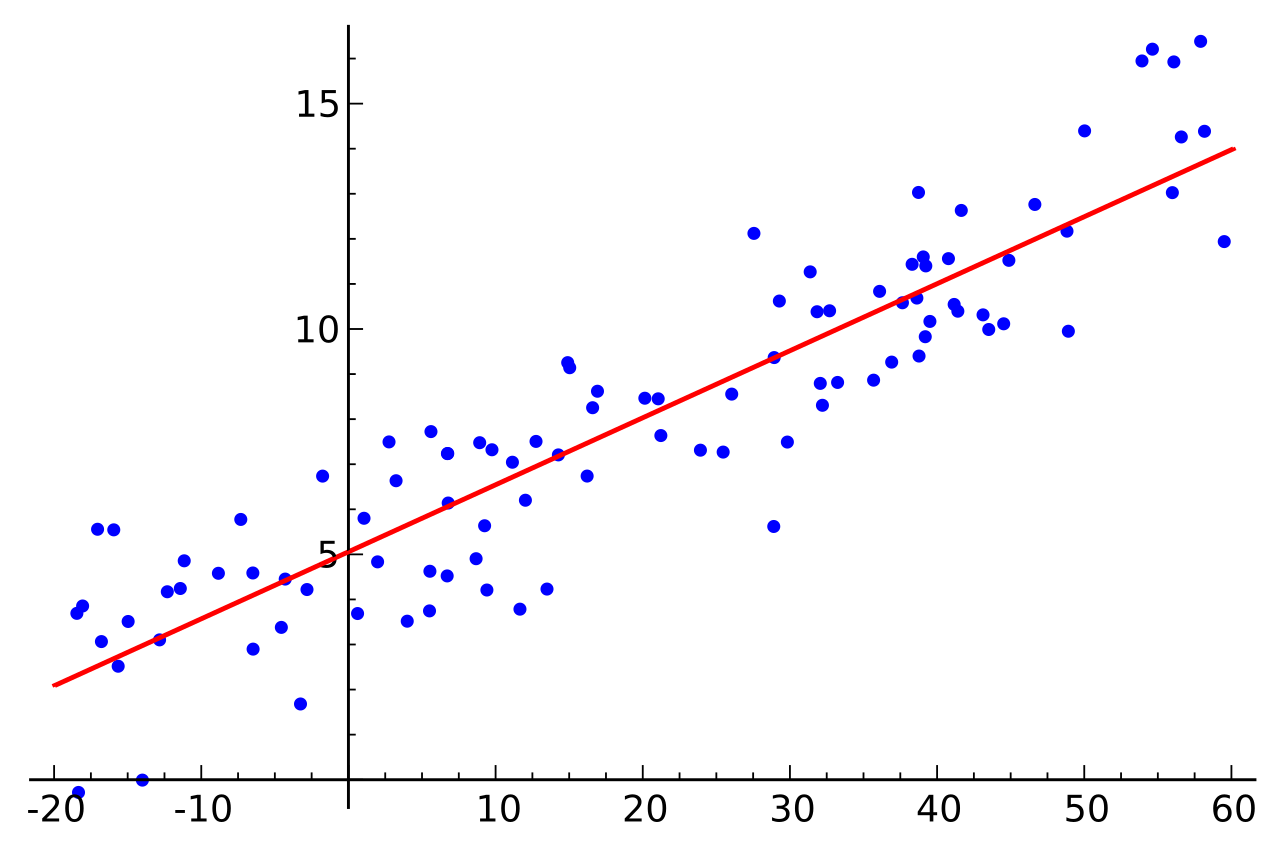
A simplified calibration curve showing a linear relationship between concentration and detector response. In gas chromatography, the y-axis represents peak area while the x-axis represents analyte concentration. Source
Requirements for a Reliable Calibration Curve
Several conditions must be met for the calibration to produce trustworthy quantitative data:
Standards must bracket the expected concentration of the sample.
The same instrument conditions (temperature, flow rate, detector settings) must be used for standards and samples.
Injection volume must remain constant.
At least three standard concentrations should be used to establish linearity.
Reproducibility of replicate injections improves reliability.
Determining Amounts Using Calibration
Once a calibration curve has been constructed:
Inject the unknown mixture under identical conditions.
Measure the peak area of the compound of interest.
Use the calibration line equation or graph to determine the corresponding concentration.
Multiply concentration by sample volume (if needed) to obtain total amount of substance.
External calibration assumes that the detector responds equally to the analyte in both sample and standard, making consistency critical. Some detectors (e.g., flame ionisation detectors) give different responses for compounds with different structures, which must be accounted for through calibration.
Detector Response Factors
A response factor accounts for deviations in detector sensitivity between different analytes. If two compounds do not generate identical responses per unit amount, calibration must incorporate response factors.
Response Factor: A proportionality constant describing how strongly a detector responds to a specific analyte relative to another or a standard.
Understanding response factors ensures that quantitative values are corrected appropriately, particularly when using an internal standard method, although this subtopic focuses on external calibration only.
A useful normal sentence here reinforces that response factors help maintain accuracy when comparing analytes with differing detector behaviours.
Determining Proportions of Components
Proportions of components in a mixture can be calculated from their relative peak areas once calibration has provided accurate area-to-amount relationships. Percentage composition can be assessed by dividing the amount of each component by the total amount of all measured components and multiplying by 100.
Key factors influencing proportion calculations include:
Detector linearity: the assumption that response remains directly proportional to amount across the calibration range.
Injection reproducibility: inconsistent injection volumes cause peak areas to vary.
Peak resolution: overlapping peaks lead to inaccurate area measurement.
Improving Quantification Accuracy
To ensure robust quantification in GC, analysts should adopt practices that improve precision and minimise systematic error:
Maintain consistent injector and detector temperatures.
Keep carrier gas flow rate constant to avoid shifts in retention time and peak shape.
Use clean, dry gas supplies to minimise noise.
Replace columns when peak tailing or poor separation interferes with integration.
Ensure sample preparation steps (dilution, extraction, drying) are performed reproducibly.
Interpreting Peak Areas in Analytical Context
GC peak areas are widely used in pharmaceutical analysis, environmental monitoring, forensic identification, and food chemistry. By applying external calibration curves, analysts can quantify pollutants, drug metabolites, volatile organic compounds, and other trace substances with high sensitivity. Understanding the relationship between peak integration and calibration is essential for applying chromatographic data effectively.
Limitations of External Calibration
External calibration has limitations that students must recognise:
Instrument drift between standard and sample injections may cause inconsistent responses.
Matrix effects can alter detector response, making standards prepared in pure solvent behave differently from real samples.
The method assumes identical injection conditions for all runs, which may not always be achievable.
Despite these limitations, GC quantification using external calibration remains a core analytical technique in A-Level Chemistry and beyond, forming the foundation for more advanced chromatographic quantification methods.
Practice Questions
A mixture containing two volatile organic compounds is analysed using gas chromatography. Explain how peak integration is used to compare the amounts of the two components in the mixture.
(2 marks)
Award up to 2 marks as follows:
1 mark for stating that the area under each peak is measured using peak integration
1 mark for stating that a larger peak area corresponds to a greater amount of that component (or that peak areas are compared to determine relative amounts)
A student uses gas chromatography with an external calibration curve to determine the composition of a liquid mixture containing compounds X and Y.
Describe how the student would use peak integration and an external calibration curve to determine:
the amount of compound X present
the proportion of compound Y in the mixture
You should refer to calibration standards and chromatogram data in your answer.
(5 marks)
Award marks for the following points (maximum 5 marks):
1 mark for stating that standards of known concentration are used to produce a calibration curve
1 mark for stating that peak area (from integration) is plotted against concentration to form the calibration curve
1 mark for explaining that the peak area of compound X in the sample is used with the calibration curve to determine its amount
1 mark for explaining that peak areas of X and Y are compared to find their relative amounts
1 mark for stating that the proportion of Y is calculated from its amount relative to the total amount of all components
Credit clear, logically sequenced answers. Answers that mention peak height instead of peak area should not be awarded full marks.
FAQ
Peak area reflects the total detector response over the entire time a compound reaches the detector, making it directly proportional to the amount present.
Peak height can be affected by peak broadening, slight changes in flow rate, or column efficiency. These factors may change the shape of the peak without changing the total amount of analyte, leading to inaccurate comparisons if height alone is used.
Different GC detectors respond differently to various compounds. Some detectors produce signals proportional to the number of carbon atoms, while others depend on molecular structure or functional groups.
Because of this, external calibration must always be performed using the same detector and conditions as the sample analysis to ensure accurate quantification.
Non-linearity may occur if detector response becomes saturated at high concentrations or if very low concentrations fall below the detector’s reliable response range.
Other causes include inconsistent injection volumes, poor instrument stability, or changes in column performance during analysis.
Changes in temperature, carrier gas flow rate, or detector settings can alter peak shape and detector response.
Running standards and samples under identical conditions ensures that peak areas are directly comparable, allowing calibration data to be applied reliably to unknown samples.
If peaks overlap, the integrated area may include contributions from more than one compound. This leads to overestimation of one component and underestimation of another.
Accurate quantification requires good separation so that each peak represents a single component reaching the detector independently.
