
OCR Specification focus:
‘Interpret one-way TLC chromatograms by calculating and comparing Rf values.’
Thin-layer chromatography (TLC) is an essential analytical technique used to separate and identify components in mixtures, and interpreting Rf values is central to its application.
Understanding Thin-Layer Chromatography
Thin-layer chromatography is a separation technique in which a mixture is spotted onto a plate coated with a thin layer of adsorbent, typically silica gel or alumina, and separated by solvent movement. As the solvent (the mobile phase) rises, different components travel at different rates due to varying attractions to the stationary phase. These differences in movement allow qualitative identification of substances within a mixture.
Chromatography: A separation technique based on the differential movement of components between a stationary phase and a mobile phase.
Thin-layer chromatography is widely used in organic chemistry laboratories because it is quick, inexpensive, and capable of analysing small quantities of material. Importantly, OCR requires students to interpret one-way TLC chromatograms by calculating and comparing Rf values, which are characteristic ratios describing how far each component travels relative to the solvent front.
TLC Plate Components and Their Roles
A TLC plate consists of several key parts that determine how effectively separation occurs. Understanding these components helps in interpreting chromatograms:
Stationary phase: Usually silica (SiO₂) or alumina (Al₂O₃), both polar materials that adsorb compounds to different extents.
Mobile phase: A carefully selected solvent or solvent mixture that must be compatible with the polarity of the substances being separated.
Baseline: The line on which samples are initially spotted.
Solvent front: The furthest point reached by the mobile phase during development.
The interaction between a compound and the stationary phase depends primarily on polarity. More polar substances bind more strongly to the plate and therefore travel shorter distances, producing smaller Rf values. Less polar substances travel further, giving larger Rf values.
Calculating Rf Values
An Rf value (retardation factor) expresses how far a compound has moved compared with the solvent front. Rf values are always between 0 and 1.
Rf (retardation factor) = Distance travelled by spot ÷ Distance travelled by solvent front
Distance travelled by spot = Measurement from baseline to centre of spot (cm)
Distance travelled by solvent front = Measurement from baseline to solvent front (cm)
Rf values are dimensionless and allow meaningful comparisons between different chromatograms, provided the same solvent system and stationary phase are used. Inconsistent conditions can produce different Rf values for the same compound, so controlling variables is essential.
Between calculating Rf values and comparing chromatographic behaviour, students must also consider experimental limitations, such as plate contamination, overlapping spots, or incorrect solvent choice.
Interpreting One-Way TLC Chromatograms
OCR emphasises that students should interpret chromatograms by calculating and comparing Rf values, linking unknown spots to known reference samples. Interpretation involves:
Identifying Components
Matching an unknown substance to a known compound requires comparing their Rf values under identical conditions. If two spots share similar Rf values and show similar appearance (e.g., colour or UV response), they are likely the same compound.
Important points include:
A compound’s Rf value is reproducible only under identical experimental conditions.
Even slight changes in solvent polarity can alter Rf significantly.
The shape and clarity of spots should also be considered qualitatively.
Assessing Purity
A pure compound produces a single spot on the TLC plate. A mixture produces two or more spots. Bullet-pointed observations include:
One spot: Indicates chemical purity, provided the spot is not streaked or diffuse.
Multiple spots: Evidence of impurities or multiple components.
Tail-ing or streaking: Can indicate overly polar solvents, strong adsorption, or over-application of sample.
Relationship Between Polarity and Rf
The polarity of both the solvent and the molecule strongly influences migration:
More polar molecules interact strongly with the stationary phase → lower Rf
Less polar molecules interact weakly → higher Rf
Increasing solvent polarity generally increases all Rf values because the mobile phase competes more effectively with the stationary phase.
These relationships help justify inferences about unknown compounds when comparing Rf values.
Improving TLC Separation for Clearer Rf Comparisons
To ensure accurate identification using Rf values, proper technique is essential. Good practice includes:
Preparing the Plate
Handle TLC plates only at the edges to avoid contamination.
Use a sharp pencil to draw the baseline and solvent front (ink may run).
Apply small, concentrated spots to avoid spreading and overlapping.
Choosing an Appropriate Solvent
The solvent must provide sufficient separation:
If Rf values are too low, use a more polar solvent.
If Rf values are too high, reduce the polarity of the solvent.
Trial-and-error solvent optimisation is common in laboratory practice.
Developing and Visualising the Plate
Place the plate in a sealed chamber to ensure saturation of solvent vapour.
Keep the solvent level below the baseline.
After development, mark the solvent front immediately.
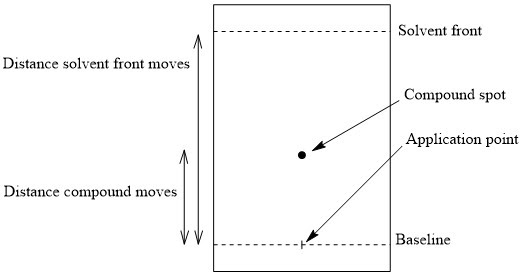
This diagram shows the key reference points on a developed TLC plate. Rf is found by comparing the distance moved by the centre of a spot with the distance moved by the solvent front, both measured from the baseline. Source
Visualise colourless compounds using UV light or staining reagents such as iodine vapour.
A carefully developed plate produces sharply defined spots that allow confident measurement of distances for Rf calculations.
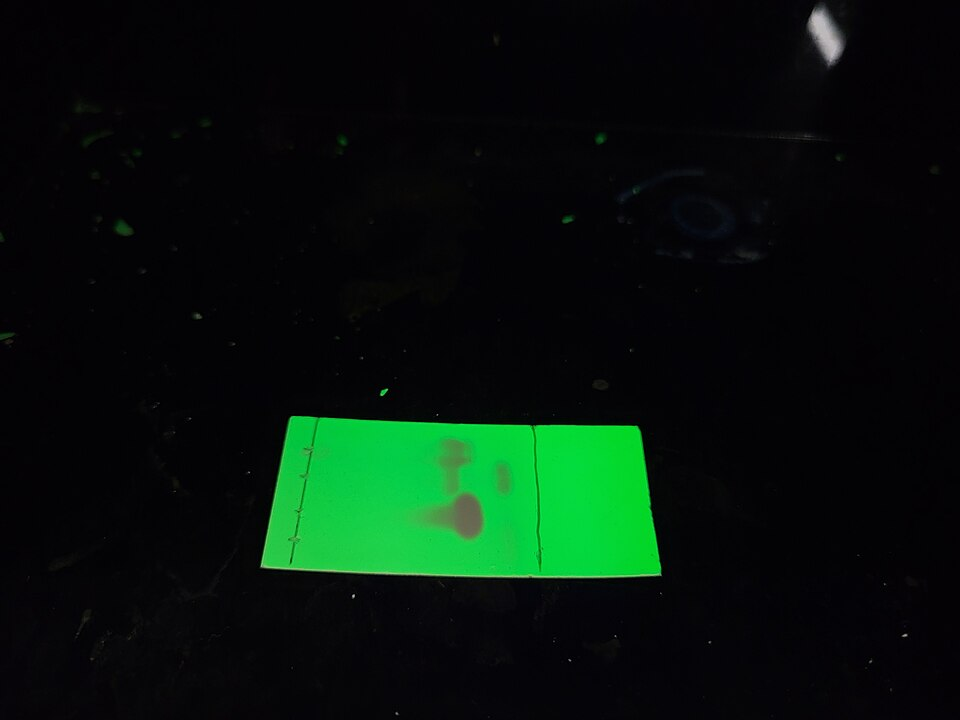
This photograph shows a developed TLC plate viewed under UV light, where separated components appear as distinct dark spots. In practice, spots are lightly marked in pencil before measuring distances for Rf. Source
Comparing Rf Values in Practice
Interpreting chromatograms relies on comparing experimental Rf values with reference data:
Reference standards should be run alongside unknowns when possible.
Acceptable experimental variation means an exact match is unlikely, but close Rf values strongly suggest identity.
Solvent and temperature consistency ensures meaningful comparisons.
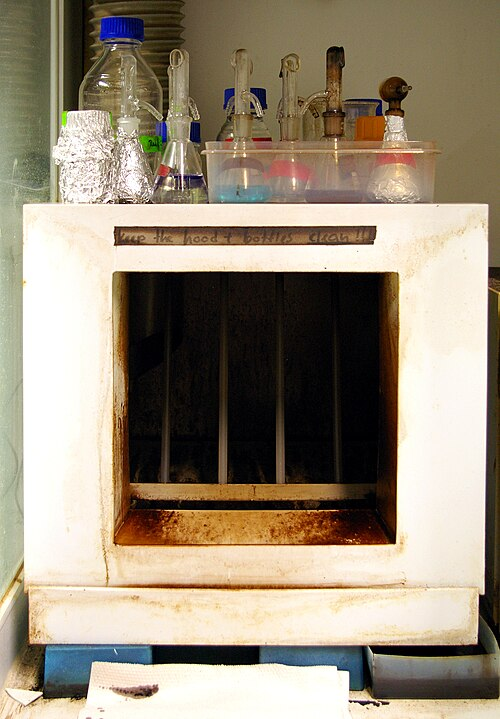
This image shows a TLC developing chamber, sealed to allow solvent vapour saturation as the solvent rises by capillary action. The solvent front is marked immediately after removal for accurate Rf determination. Source
By calculating Rf values accurately and comparing them logically, students can deduce the likely identity of unknown compounds using one-way TLC, directly fulfilling this OCR specification requirement.
Practice Questions
A TLC plate is used to analyse a reaction mixture and a pure reference compound under identical conditions.
The reaction mixture produces two spots with Rf values of 0.35 and 0.62.
The pure reference compound produces a single spot with an Rf value of 0.35.
(a) State what conclusion can be drawn about the composition of the reaction mixture.
(b) Explain why Rf values can only be compared if the chromatograms are run under the same conditions.
(5 marks)
(a) Conclusion about composition (2 marks)
Reaction mixture contains the same compound as the reference (matching Rf of 0.35)
1 mark
Reaction mixture also contains at least one additional compound / is not pure
1 mark
(b) Explanation of identical conditions (3 marks)
Rf values depend on the stationary phase used
1 mark
Rf values depend on the solvent / mobile phase or its polarity
1 mark
Changing conditions would change distances travelled and therefore alter Rf values
1 mark
A student carries out thin-layer chromatography on a mixture. One spot travels 3.2 cm from the baseline, while the solvent front travels 8.0 cm.
Calculate the Rf value for this spot.
(2 marks)
Correct use of Rf expression (distance travelled by spot ÷ distance travelled by solvent front)
1 mark
Correct numerical answer of 0.40 (3.2 ÷ 8.0), with or without units
1 mark
FAQ
Ink contains dyes that are soluble in many organic solvents used as the mobile phase.
As the solvent rises, the ink can dissolve and move up the plate, creating extra spots that interfere with the chromatogram and make Rf measurements unreliable.
Using a pencil avoids this problem because graphite is insoluble and remains fixed on the plate.
Spots often spread slightly as the solvent moves up the plate.
Measuring to the centre gives a consistent reference point that best represents the average movement of the compound.
Measuring from the top or bottom of a spot would introduce systematic error and reduce the reliability of the calculated Rf value.
Streaking usually occurs when experimental conditions are unsuitable.
Common causes include:
Applying too much sample to the plate
Using a solvent that is too polar
Strong attraction between the compound and the stationary phase
Streaking makes Rf values difficult to measure accurately and reduces the effectiveness of the separation.
Running samples side by side ensures both experience identical experimental conditions.
This allows direct comparison of Rf values without uncertainty from solvent composition, temperature, or plate differences.
A matching Rf value under these conditions provides stronger evidence that two samples contain the same compound.
The solvent front defines the maximum possible distance that any compound can travel.
A compound cannot move further than the solvent itself, so its distance travelled must always be less than the distance travelled by the solvent front.
As a result, Rf values are ratios that always fall between 0 and 1.
