
OCR Specification focus:
‘Identify proton environments, chemical shifts, and relative numbers from integration traces or ratios.’
Proton NMR provides essential structural information by revealing the number of unique proton environments and the relative quantities of protons contributing to each signal.
Proton Environments in ¹H NMR
Proton environments arise because hydrogen atoms in different chemical surroundings absorb radiofrequency energy at different frequencies. A signal in a proton NMR spectrum corresponds to a set of chemically equivalent protons.
What Determines a Proton Environment?
Several structural features influence whether protons belong to the same or different environments, and understanding these helps interpret spectra accurately.
Functional groups attached to the carbon bearing the proton
Electronegativity of nearby atoms
Hybridisation of the carbon atom
Proximity to π-systems, such as benzene rings or C=C bonds
Molecular symmetry, which reduces the number of unique environments
When discussing proton environments, chemical equivalence is central.
Chemical equivalence: Protons that experience identical electronic surroundings and therefore produce the same NMR signal.
Chemically equivalent protons contribute collectively to a single resonance peak, whereas inequivalent protons form separate peaks. This distinction must be assessed before interpreting other NMR features such as integration.
A molecule’s symmetry often reduces the number of proton environments. When identical groups are related by a symmetry element, their protons resonate together. Recognising this prevents misinterpreting duplicated structural motifs as multiple environments.
Chemical Shift and its Relationship to Environment
The chemical shift indicates how electron density around a proton affects the frequency at which it resonates. Chemical shift data allow chemists to predict broad structural features.
Chemical shift: A measure of the relative resonance frequency of a proton compared to a standard reference compound (TMS), expressed in parts per million (ppm).
Chemical shift appears on the x-axis of a proton NMR spectrum and typically ranges from 0–12 ppm. Although precise values vary depending on molecular context, common ranges help place proton types into categories.
Signals are plotted against chemical shift (δ) in ppm, with TMS at 0 ppm; peaks to the left are downfield (deshielded) and to the right are upfield (shielded).
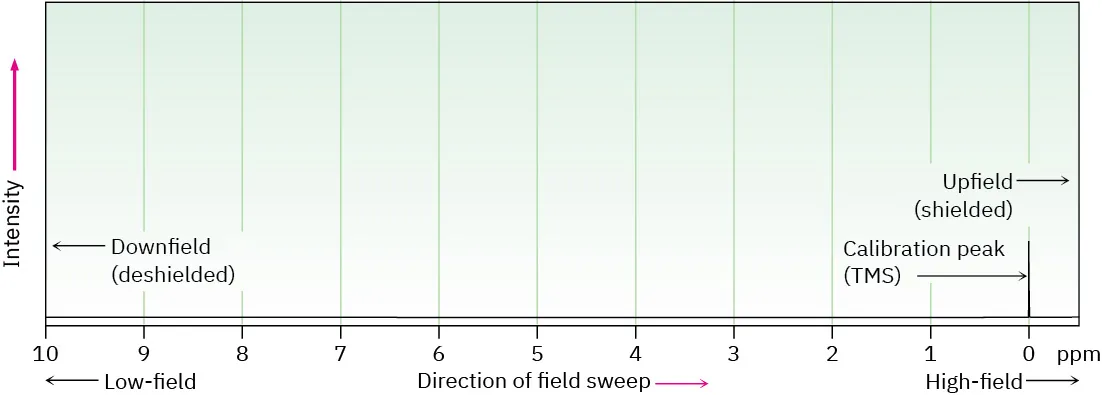
This diagram shows the ¹H NMR chemical shift scale in parts per million, referenced to TMS at 0 ppm. Peaks to the left are deshielded (downfield), while peaks to the right are shielded (upfield). Source
Factors Affecting Chemical Shift
Electron-withdrawing groups (e.g., carbonyls, halogens) deshield protons, shifting their signals to higher ppm.
Electron-donating groups (e.g., alkyl substituents) shield protons, shifting peaks to lower ppm.
Aromatic systems create anisotropic effects that shift aryl protons into the 6–9 ppm region.
Hydrogen-bonding can cause broadening or shifting, particularly for O–H and N–H protons.
One normal sentence must appear here before any further structured content, and the interpretation of chemical shift always depends on evaluating all proton environments collectively.
Integration and Relative Number of Protons
Integration is a fundamental part of ¹H NMR analysis because it reveals the relative number of protons contributing to each signal. The OCR specification emphasises that students must identify proton environments, chemical shifts, and relative numbers from integration traces or ratios, making integration indispensable.
What Does Integration Represent?
Integration corresponds to the area under an NMR peak, which is proportional to how many protons contributed to that signal.
Integration: A measure of the area under an NMR signal that reflects the relative number of protons producing that signal.
An integration curve or printed ratio allows direct comparison of proton quantities. Although integration ratios are not usually normalised to whole numbers automatically, students convert them into the smallest whole-number ratio to deduce the proton count in each environment.
In practice, an integration ratio such as 3:2 suggests one environment contains protons in a 3-to-2 ratio relative to the other.
Using Integration to Deduce Proton Ratios
Integration alone does not specify which protons belong to which environment, so it must be assessed alongside chemical shifts and molecular structure.
To interpret integration ratios effectively:
Compare integration values for all peaks
Convert the integration values into the simplest whole-number ratio
Consider whether typical organic fragments (CH₃, CH₂, CH, aromatic protons) match the ratio
Check consistency with the number of proton environments
One sentence must appear here before introducing structured bullet points, and the integration data should always be used alongside chemical shift ranges to avoid misinterpretation.
Recognising Typical Proton Ratios
Common fragment patterns provide a helpful reference when matching integration data to molecular structure.
CH₃ groups typically correspond to an integration of 3
CH₂ groups correspond to an integration of 2
CH groups correspond to an integration of 1
Equivalent aromatic protons may integrate to 2, 3, 4, or 5 depending on substitution pattern
Alcohol or amine protons often appear as singlets with variable integration due to exchange
Linking Environments, Chemical Shifts, and Integration
Proton NMR interpretation relies on combining the three pieces of information required by the OCR specification:
Proton environments: Determine the number of unique hydrogen environments
Chemical shifts: Provide clues about the functional groups and electron density
Integration ratios: Indicate the relative numbers of protons in each environment
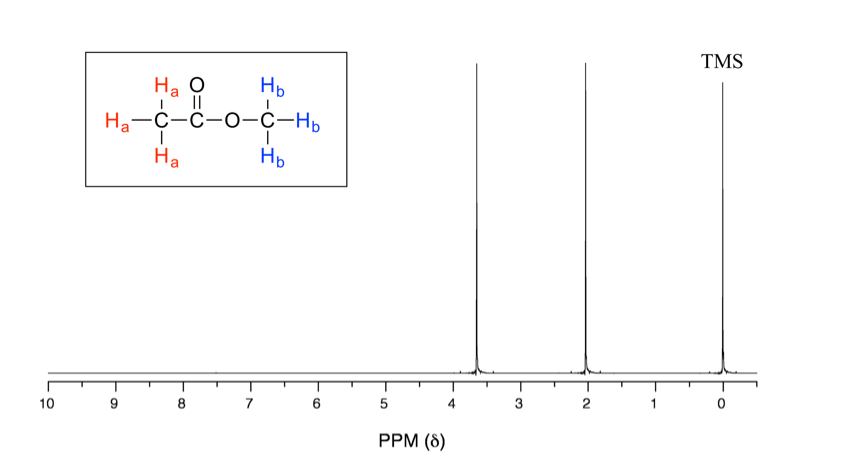
These structures illustrate chemical equivalence in proton NMR. Protons related by molecular symmetry occupy the same environment and therefore give rise to a single ¹H NMR signal. Source
Together, these features enable construction of a consistent model of a molecule’s hydrogen framework. Careful correlation of all three avoids errors such as miscounting symmetric protons or misassigning deshielded peaks.
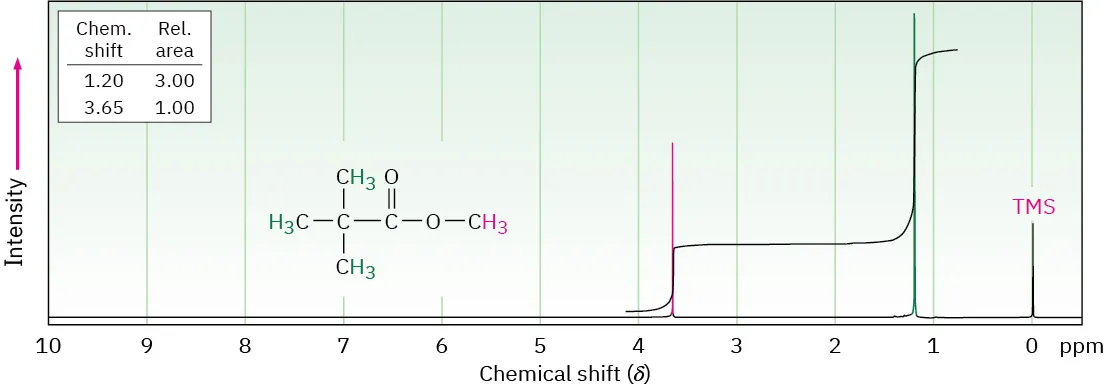
The spectrum shows an integration trace, where step height is proportional to peak area and hence to the relative number of protons. Integration ratios allow comparison of proton counts between different environments. Source
Practice Questions
A proton NMR spectrum of an organic compound shows three distinct signals.
Explain what this indicates about the proton environments in the molecule and state one reason why some protons may be chemically equivalent.
(2 marks)
Three signals indicate three different proton environments in the molecule (1 mark)
Chemically equivalent protons experience the same chemical environment and therefore give a single NMR signal (1 mark)
An organic compound has the molecular formula C4H10O. Its proton NMR spectrum shows two signals with chemical shifts at approximately 1.2 ppm and 3.4 ppm. The integration ratio of the peaks is 9:1.
(a) State what the integration ratio indicates about the relative numbers of protons in each environment.
(b) Explain why the signal at 3.4 ppm appears at a higher chemical shift than the signal at 1.2 ppm.
(c) Suggest what type of proton environment is likely to give rise to the signal at 3.4 ppm.
(5 marks)
(a)
The 9:1 integration ratio shows there are nine protons in one environment and one proton in the other environment (1 mark)
(b)
The proton at 3.4 ppm is in an environment close to an electronegative atom such as oxygen (1 mark)
The electronegative atom withdraws electron density, deshielding the proton (1 mark)
Deshielded protons absorb at higher chemical shift values (1 mark)
(c)
A proton bonded to a carbon attached to oxygen, such as in an alcohol or ether environment (1 mark)
FAQ
Integration values are proportional to peak area and are often scaled automatically by the spectrometer rather than normalised to whole numbers.
As a result, the values may appear as decimals or unusual ratios. These must be converted into the simplest whole-number ratio to reflect the relative numbers of protons in each environment.
Small inaccuracies can also arise from baseline noise or overlapping peaks, but these do not affect the overall ratio when interpreted correctly.
Molecular symmetry can reduce the number of distinct proton environments by making certain protons chemically equivalent.
When symmetry is present, multiple hydrogens experience identical electronic surroundings and therefore produce a single signal. This leads to fewer peaks than might be expected from simply counting hydrogen atoms.
Recognising symmetry is essential for accurate interpretation, particularly in molecules with repeated structural units.
O–H protons readily exchange with trace water or other protic impurities in the solvent.
This rapid exchange can cause their signals to appear broadened, weak, or variable in position and integration. As a result, the integration of O–H peaks often does not accurately represent the true number of protons present.
For this reason, O–H protons are usually excluded when using integration to determine proton ratios.
Yes, different proton environments can sometimes resonate at similar chemical shift values, especially if their electronic surroundings are comparable.
This can lead to overlapping or closely spaced peaks, making interpretation more challenging. In such cases, integration and peak shape become particularly important for distinguishing environments.
Careful analysis of the entire spectrum is required to avoid misassigning signals.
Integration measures peak area relative to other peaks in the same spectrum, not the absolute number of protons.
The total scale depends on instrument settings and sample concentration, so integration values must always be compared as ratios rather than taken as fixed counts.
Only by converting these ratios into whole numbers can the relative proton environments within the molecule be determined accurately.
