
OCR Specification focus:
‘Interpret and predict IR spectra of familiar or unfamiliar substances using supplied data; restrict interpretations to functional groups in the specification.’
Infrared spectroscopy allows chemists to identify functional groups in unknown organic molecules by analysing characteristic absorption peaks and applying systematic, evidence-based interpretation strategies carefully.
Purpose of Interpreting Unfamiliar IR Spectra
Interpreting unfamiliar IR spectra involves using provided spectral data to deduce which functional groups are present or absent in an organic compound. At A-Level, this skill focuses on recognition rather than memorisation, with data always supplied in exams. The emphasis is on linking absorption peaks to known bond vibrations and avoiding speculation beyond the syllabus.
Infrared spectroscopy measures how molecules absorb infrared radiation, causing covalent bonds to vibrate. Different bonds absorb IR radiation at characteristic wavenumbers (cm⁻¹), allowing identification of functional groups encountered in the specification.
Key Principle of IR Interpretation
IR spectra should be interpreted systematically, focusing only on functional groups listed in the OCR specification. Students are not expected to identify entire molecular structures or unfamiliar functional groups.
Absorption Peaks and Bond Vibrations
An absorption peak corresponds to a specific bond vibration within a molecule. The position and shape of peaks provide diagnostic information.
Absorption peak: A region in an IR spectrum where infrared radiation is absorbed due to vibration of a specific covalent bond.
Each peak arises because the bond absorbs energy that matches its natural vibrational frequency. Stronger bonds generally absorb at higher wavenumbers.
A clear understanding of this principle supports confident interpretation without overcomplication.
Functional Groups Within the OCR Specification
When interpreting unfamiliar spectra, restrict analysis to functional groups specified in Module 4, particularly those emphasised in infrared spectroscopy.
Alcohols (O–H)
Alcohols show a broad O–H absorption due to hydrogen bonding between molecules.
Key features:
Broad peak between 3200–3600 cm⁻¹
Often overlaps with C–H absorptions
Indicates presence of an –OH group bonded to carbon
The breadth of this peak distinguishes alcohols from other functional groups.
Alcohol O–H absorption is typically broad in the 3200–3600 cm⁻¹ region due to hydrogen bonding.
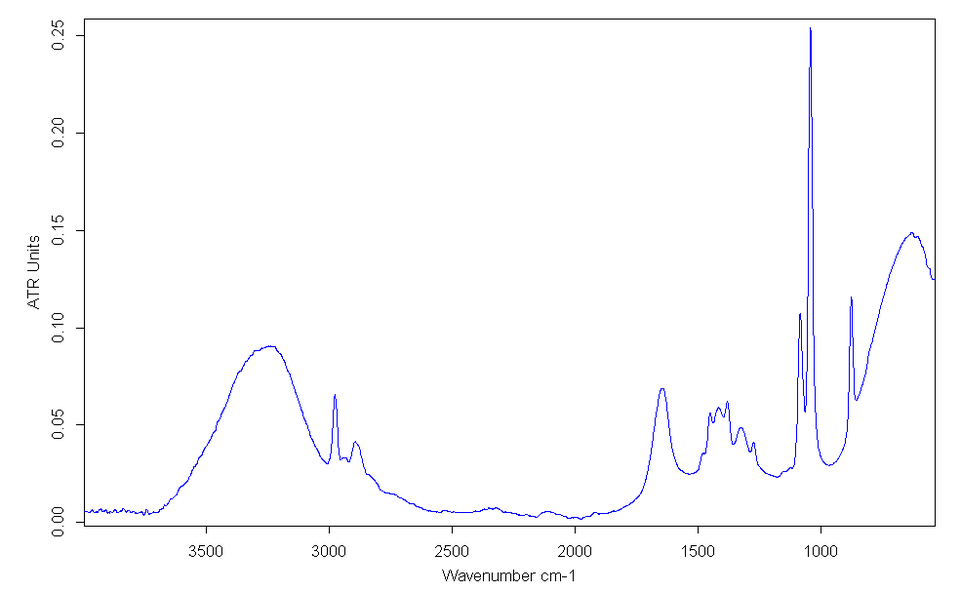
Mid-infrared spectrum of ethanol showing the characteristic broad O–H stretching absorption between 3200–3600 cm⁻¹. The breadth of the peak reflects hydrogen bonding between alcohol molecules. Source
Aldehydes and Ketones (C=O)
Carbonyl compounds contain a C=O double bond, which produces a strong and sharp absorption.
Key features:
Strong, sharp peak around 1700 cm⁻¹
Present in both aldehydes and ketones
Cannot distinguish aldehydes from ketones using IR alone
The intensity of this peak makes it one of the most reliable indicators in IR spectra.
Carboxylic Acids (O–H and C=O)
Carboxylic acids contain both a carbonyl group and a hydroxyl group, leading to a distinctive combination of absorptions.
Key features:
Broad O–H peak between 2500–3300 cm⁻¹
Strong C=O peak near 1700 cm⁻¹
O–H absorption broader than in alcohols
Carboxylic acids can be identified by a broad O–H band around 2500–3300 cm⁻¹ alongside a strong C=O absorption near 1700 cm⁻¹.
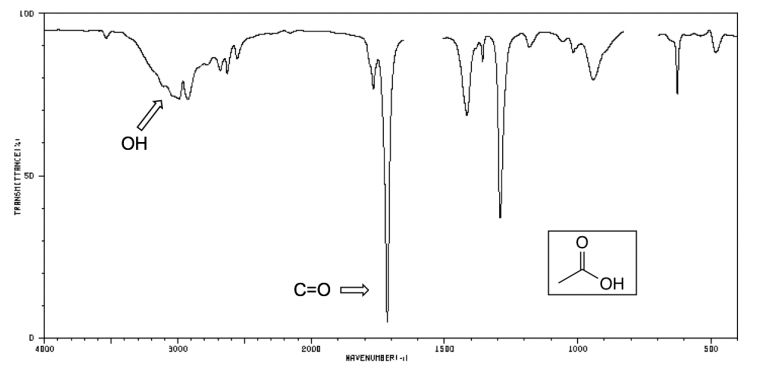
Infrared spectrum of acetic acid showing the diagnostic combination of a very broad O–H absorption (2500–3300 cm⁻¹) and a strong C=O peak near 1700 cm⁻¹. The presence of both peaks together identifies a carboxylic acid functional group. Source
The presence of both peaks together is diagnostic for carboxylic acids.
C–H Absorptions and Their Significance
Most organic compounds show absorptions due to C–H bonds, making these peaks common but less diagnostic.
Key features:
Absorptions near 3000 cm⁻¹
Present in alkanes, alkenes, and aromatic compounds
Not used alone to identify functional groups
While useful for confirming organic nature, C–H peaks should not be overinterpreted.
Strategy for Interpreting Unfamiliar Spectra
A structured approach ensures accurate and syllabus-aligned interpretation.
Step-by-Step Method
Identify any broad O–H peaks first
Look for a strong C=O absorption around 1700 cm⁻¹
Check for combinations of peaks indicating specific functional groups
Ignore peaks not associated with specification content
This approach prevents misidentification and ensures clarity under exam conditions.
Using Supplied Data Effectively
In OCR examinations, students are provided with:
Peak position data
Reference absorption ranges
Contextual information about possible compounds
Students should rely on these resources rather than recall exact values. Precision is not required beyond recognising characteristic ranges.
Wavenumber: The reciprocal of wavelength, measured in cm⁻¹, used to express energy of infrared radiation absorbed by a bond.
Understanding wavenumber as an energy measure helps explain why different bonds absorb at different positions.
Limitations of IR Spectroscopy
IR spectroscopy identifies functional groups, not complete molecular structures. Several important limitations must be recognised:
Cannot determine molecular formula
Cannot distinguish between isomers
Cannot differentiate aldehydes from ketones
These limitations mean IR data is often combined with other analytical techniques, though interpretation here must remain restricted to IR evidence only.
A C=O bond produces a strong, sharp absorption typically around 1650–1750 cm⁻¹, so a deep band here is strong evidence for a carbonyl-containing compound.
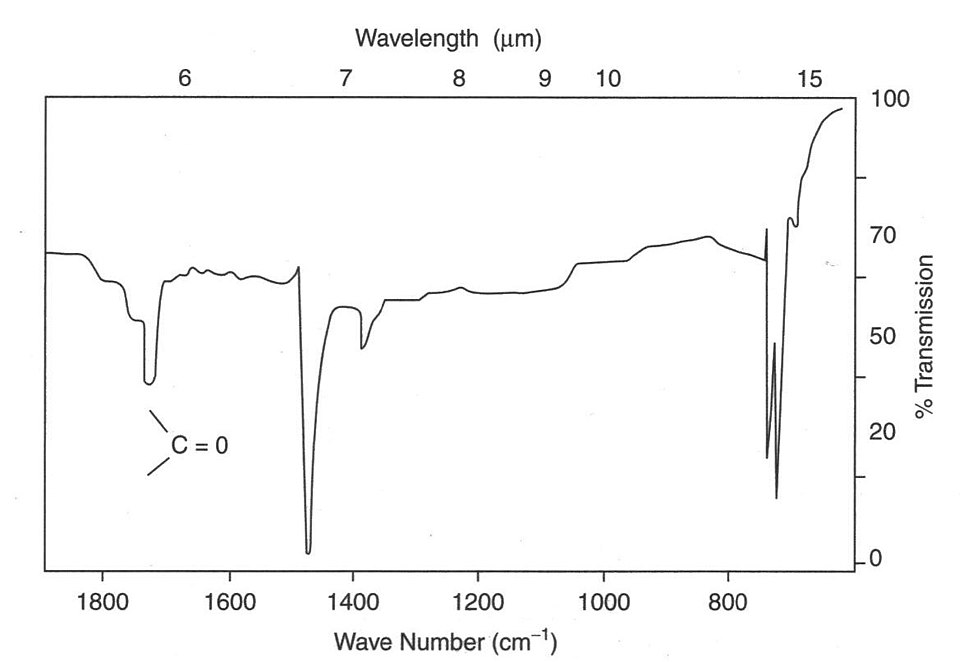
IR spectrum highlighting a strong carbonyl (C=O) absorption near 1700 cm⁻¹. The spectrum includes additional polymer-related features not required by the OCR syllabus; focus should be placed only on the position and intensity of the carbonyl band. Source
Avoiding Common Errors
When interpreting unfamiliar spectra, common mistakes include:
Identifying functional groups outside the specification
Overinterpreting minor or weak peaks
Ignoring peak shape and breadth
Attempting full structural deduction
Correct interpretation relies on restraint, evidence, and alignment with provided data.
Linking Interpretation to OCR Assessment Expectations
OCR expects students to:
Correctly identify functional groups from IR spectra
Use supplied data accurately
Apply knowledge only from the specification
Communicate conclusions clearly and precisely
Confidence in interpreting unfamiliar IR spectra comes from repeated practice using systematic analysis rather than memorisation.
Practice Questions
An unfamiliar organic compound produces an infrared spectrum with a strong, sharp absorption at approximately 1700 cm⁻¹ and no broad absorption between 2500–3600 cm⁻¹.
Identify the functional group present and justify your answer using the infrared data.
(2 marks)
Identifies the carbonyl (C=O) functional group (1 mark)
Justifies answer by linking the strong, sharp absorption at ~1700 cm⁻¹ to a C=O bond (1 mark)
An unknown organic compound has the following infrared absorption features:
A very broad absorption between 2500–3300 cm⁻¹
A strong absorption near 1700 cm⁻¹
Absorptions close to 3000 cm⁻¹
Using this information:
Identify the functional group present.
Explain how the infrared spectrum supports your identification.
State one limitation of infrared spectroscopy when analysing unfamiliar organic compounds.
(5 marks)
Identifies the compound as a carboxylic acid (1 mark)
Correctly links the broad absorption at 2500–3300 cm⁻¹ to an O–H group in a carboxylic acid (1 mark)
Correctly links the strong absorption near 1700 cm⁻¹ to a C=O bond (1 mark)
Recognises that the combination of O–H and C=O absorptions is diagnostic of a carboxylic acid (1 mark)
States a valid limitation of infrared spectroscopy, such as:
Cannot distinguish between structural isomers
Cannot determine the full molecular structure
Cannot differentiate between aldehydes and ketones (1 mark)
Maximum 5 marks.
FAQ
O–H absorptions vary in breadth because of differences in hydrogen bonding strength and extent. In alcohols, hydrogen bonding is present but relatively limited, producing a broad band around 3200–3600 cm⁻¹.
In carboxylic acids, extensive intermolecular hydrogen bonding forms dimers. This results in a much broader and more intense O–H absorption spanning approximately 2500–3300 cm⁻¹, which is highly diagnostic.
Both aldehydes and ketones contain the same functional group: the carbonyl (C=O). This bond absorbs strongly at around 1700 cm⁻¹ in both cases.
Infrared spectroscopy detects bond vibrations, not the surrounding molecular environment. As a result, the spectra of aldehydes and ketones appear very similar, requiring other analytical techniques for differentiation.
Supplied data focuses assessment on interpretation rather than memorisation. OCR expects students to recognise patterns and link absorption ranges to functional groups using given information.
This approach tests understanding of:
Characteristic absorption ranges
Peak shape and intensity
Logical deduction from limited evidence
It also reflects real laboratory practice, where reference data is commonly used.
C–H bonds are present in nearly all organic molecules, so absorptions near 3000 cm⁻¹ occur in many spectra. These peaks confirm the compound is organic but do not indicate a specific functional group.
Because they lack uniqueness, C–H absorptions must be interpreted alongside more diagnostic peaks such as O–H or C=O.
Peak intensity reflects how strongly a bond absorbs infrared radiation. Polar bonds, such as C=O, absorb strongly and produce deep, sharp peaks.
Less polar bonds generate weaker absorptions. Recognising strong versus weak peaks helps prioritise which absorptions are most meaningful when analysing unfamiliar spectra under exam conditions.
