
OCR Specification focus:
‘Deduce structures from elemental analysis, mass spectra and IR spectra; apply to pollution monitoring (e.g. CO and NO) and breathalysers measuring ethanol.’
This topic explains how chemists combine analytical data to identify unknown organic structures, integrating elemental analysis, infrared spectroscopy and mass spectrometry into a coherent, logical process.
Purpose of Combining Analytical Data
No single analytical technique is sufficient to identify an unknown organic compound conclusively. Elemental analysis, infrared spectroscopy (IR) and mass spectrometry (MS) each provide partial structural information. When combined, these data sets allow chemists to deduce the molecular formula, functional groups, and key structural features.
The OCR specification requires students to understand how these techniques complement one another rather than treating them in isolation. Logical interpretation, rather than memorisation, is emphasised.
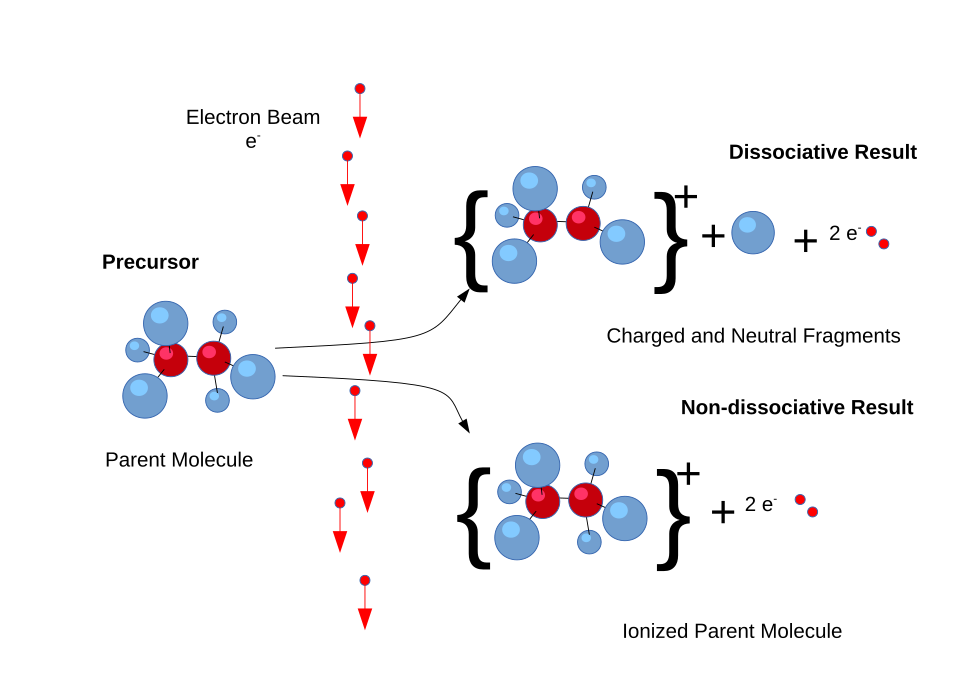
This diagram shows electron ionisation, where a molecule loses an electron to form a molecular ion, which may then break into fragment ions detected in a mass spectrum. It illustrates why mass spectra contain both an M⁺ peak and characteristic fragment peaks. Some mechanistic detail exceeds OCR requirements but supports understanding of fragmentation. Source
Elemental Analysis: Establishing Composition
Elemental analysis determines the percentage by mass of elements such as carbon, hydrogen, oxygen, nitrogen, or halogens in a compound. From these percentages, the empirical formula can be calculated.
Empirical formula: The simplest whole-number ratio of atoms of each element present in a compound.
Elemental analysis alone cannot provide full structural detail, but it sets strict limits on possible formulas. When combined with a molecular mass from mass spectrometry, the molecular formula can be deduced.
A clear understanding of elemental composition is essential before interpreting spectral data, as it prevents proposing chemically impossible structures.
Mass Spectrometry: Molecular Mass and Fragmentation
Mass spectrometry provides the relative molecular mass of a compound and information about how it fragments.
Molecular ion (M⁺): The positively charged ion formed when a molecule loses one electron without fragmenting, giving a mass equal to the molecular mass.
The molecular ion peak is used to determine the molecular mass. This value is compared with the empirical formula mass to confirm or adjust the molecular formula.
Mass spectra also show fragment peaks, which indicate how the molecule breaks apart. These fragments can suggest:
The presence of alkyl groups
The stability of certain carbocations
The likelihood of specific functional groups
For OCR A-Level, detailed fragmentation mechanisms are not required, but students should recognise that consistent fragment patterns help distinguish between structural isomers.
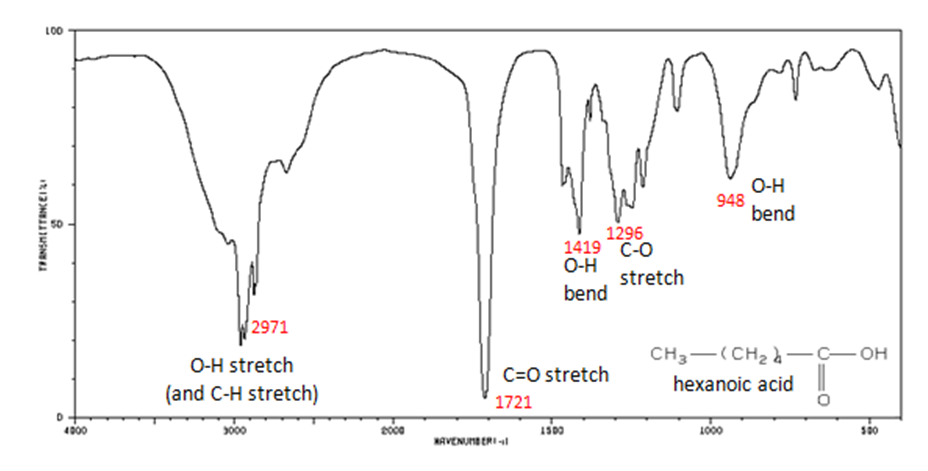
This infrared spectrum highlights the broad O–H absorption and strong C=O stretch used to identify functional groups. The labelled peaks demonstrate how IR data confirms or excludes whole classes of compounds when deducing structures. Some additional labelled vibrations are beyond the minimum OCR specification but remain consistent with it. Source
Infrared Spectroscopy: Identifying Functional Groups
Infrared spectroscopy identifies functional groups by detecting characteristic bond vibrations. IR data significantly narrows down possible structures.
Key absorptions relevant to this topic include:
O–H stretch (alcohols): Broad absorption around 3200–3600 cm⁻¹
C=O stretch: Sharp absorption near 1700 cm⁻¹
C–H stretch: Absorption close to 3000 cm⁻¹
Functional group: A specific group of atoms within a molecule responsible for its characteristic chemical reactions and properties.
IR spectra do not provide full structures but confirm or eliminate entire classes of compounds, making them essential in combination with MS and elemental analysis.
Logical Integration of Data
The key skill assessed by OCR is the stepwise integration of data. A typical approach involves:
Using elemental analysis to determine possible formulas
Using the molecular ion peak to confirm molecular mass
Using IR spectra to identify functional groups
Checking mass spectral fragments for structural consistency
Each technique must support the others. If one data source contradicts a proposed structure, that structure must be rejected.
Distinguishing Between Isomers
Structural isomers share the same molecular formula but differ in structure. Combined analytical data allows these to be distinguished:
IR spectra differentiate functional groups
Mass spectra show different fragmentation patterns
Elemental analysis confirms identical composition but not structure
This reinforces why multiple techniques are essential, particularly when several plausible structures exist.
Applications: Pollution Monitoring
The specification requires applying these analytical techniques to real-world contexts, including pollution monitoring.
Small molecules such as carbon monoxide (CO) and nitrogen monoxide (NO) can be identified using combined data:
Elemental composition confirms elemental content
Mass spectrometry provides molecular mass
IR spectroscopy identifies characteristic bond absorptions
This approach is vital for monitoring air quality and enforcing environmental regulations.
Applications: Breathalysers and Ethanol Detection
Breathalysers rely on identifying ethanol in exhaled air. Analytical principles underpin their development:
Elemental analysis confirms the presence of carbon, hydrogen, and oxygen
Mass spectrometry confirms molecular mass consistent with ethanol
IR spectroscopy identifies the O–H functional group
Although operational breathalysers use simplified methods, the underlying science is rooted in the same analytical techniques studied at A-Level.
Limitations and Reliability
Each technique has limitations:
Elemental analysis cannot distinguish isomers
IR spectroscopy does not give full molecular structures
Mass spectrometry alone may produce ambiguous fragments
Combining techniques increases confidence and reliability, which is why modern chemical analysis always integrates multiple data sources.
Practice Questions
An unknown organic compound contains carbon, hydrogen and oxygen only. Its infrared spectrum shows a strong absorption at about 1700 cm–1 but no broad absorption between 3200 and 3600 cm–1.
What functional group is present, and what functional group is absent?
(2 marks)
Identifies a carbonyl (C=O) functional group present (1 mark)
States that an O–H (alcohol) functional group is absent (1 mark)
An unknown organic compound gives the following analytical data:
Elemental analysis shows the compound contains carbon, hydrogen and oxygen only.
The molecular ion peak in the mass spectrum occurs at m/z = 60.
The infrared spectrum shows a broad absorption between 3200 and 3600 cm–1 and no absorption near 1700 cm–1.
Using this information, deduce the most likely functional group present in the compound and explain how each piece of data supports your conclusion.
(5 marks)
Uses elemental analysis to state that the compound contains only C, H and O, limiting possible functional groups (1 mark)
Correctly interprets the molecular ion peak at m/z = 60 as the molecular mass of the compound (1 mark)
Identifies the broad absorption between 3200 and 3600 cm–1 as evidence for an O–H group (1 mark)
States that the absence of an absorption near 1700 cm–1 indicates no C=O group (1 mark)
Correctly deduces that the compound is most likely an alcohol and links this conclusion to the combined data (1 mark)
FAQ
Fragment peaks arise when the molecular ion breaks apart and therefore have lower m/z values than the original molecule.
Only the molecular ion peak represents the intact molecule, so it gives the true molecular mass needed to confirm the molecular formula.
Using fragment peaks instead can lead to underestimating the molecular mass and proposing incorrect structures.
Elemental analysis shows which elements are present and which are absent.
If no oxygen is detected, functional groups such as alcohols or carbonyl compounds can be eliminated immediately.
Similarly, the presence of nitrogen or halogens would restrict the possible structures, narrowing interpretation of IR and mass spectra.
Some molecules form unstable molecular ions that fragment very rapidly after ionisation.
This can result in a weak or missing M⁺ peak, with fragment peaks dominating the spectrum.
In such cases, chemists rely more heavily on fragment patterns and supporting IR data to infer molecular mass and structure.
Each technique has limitations when used alone.
By cross-checking molecular mass, functional groups, and elemental composition, inconsistent structures can be rejected early.
This layered approach ensures that all proposed structures are chemically and spectroscopically consistent with every piece of data.
IR spectroscopy identifies functional groups but provides little information about carbon chain length or branching.
Many different molecules can share the same functional groups and therefore have similar IR spectra.
This is why IR must be used alongside mass spectrometry and elemental analysis to deduce complete structures.
