
OCR Specification focus:
‘Use concentration–time graphs to identify 0 or 1 order, measure rates from gradients, and note constant half-life.’
Concentration–time graphs show how reactant or product amounts change during reactions, allowing chemists to identify reaction order, compare rates, and interpret half-life behaviour accurately.
Concentration–Time Graphs in Chemical Kinetics
Concentration–time graphs plot concentration on the y-axis against time on the x-axis. They visually represent how fast a reaction proceeds and how this rate changes as reactants are used up. For OCR A-Level Chemistry, these graphs are primarily used to distinguish between zero-order and first-order reactions and to extract rate information.
A typical reactant concentration–time graph slopes downwards because reactant concentration decreases as the reaction progresses. The steepness of the curve at any point indicates how fast the reaction is at that moment.
Measuring Rate from a Concentration–Time Graph
The rate of reaction at a specific time is determined from the gradient of the tangent to the curve at that point. A steeper gradient corresponds to a faster rate.
Rate of reaction: The change in concentration of a reactant or product per unit time, typically measured in mol dm⁻³ s⁻¹.
The gradient is usually negative for reactants because concentration decreases, but rate is expressed as a positive value.
To obtain the gradient:
Draw a tangent to the curve at the chosen time.
Calculate the change in concentration divided by the change in time.
Use consistent units throughout.
This method allows comparison of rates at different times during the same reaction.
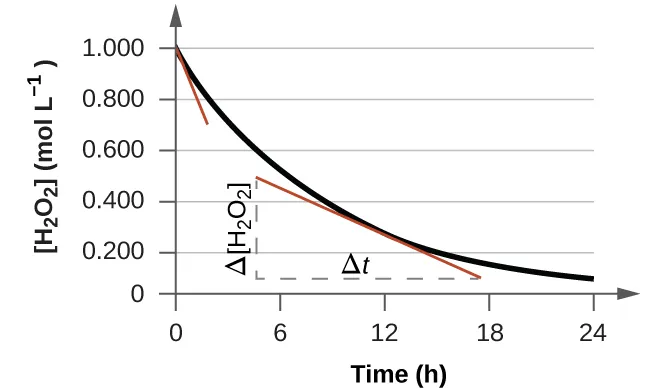
The instantaneous rate of reaction is obtained from the gradient of a tangent drawn to the concentration–time curve at a specific time. Source
Identifying Zero-Order Reactions
In a zero-order reaction, the rate is independent of the concentration of the reactant. This behaviour produces a distinctive concentration–time graph.
Key features of zero-order concentration–time graphs:
A straight-line decrease in concentration with time.
A constant gradient, showing the rate remains constant.
The reaction stops abruptly when the reactant is fully consumed.
For a zero-order reaction, the concentration–time graph is a straight line because the rate is constant.
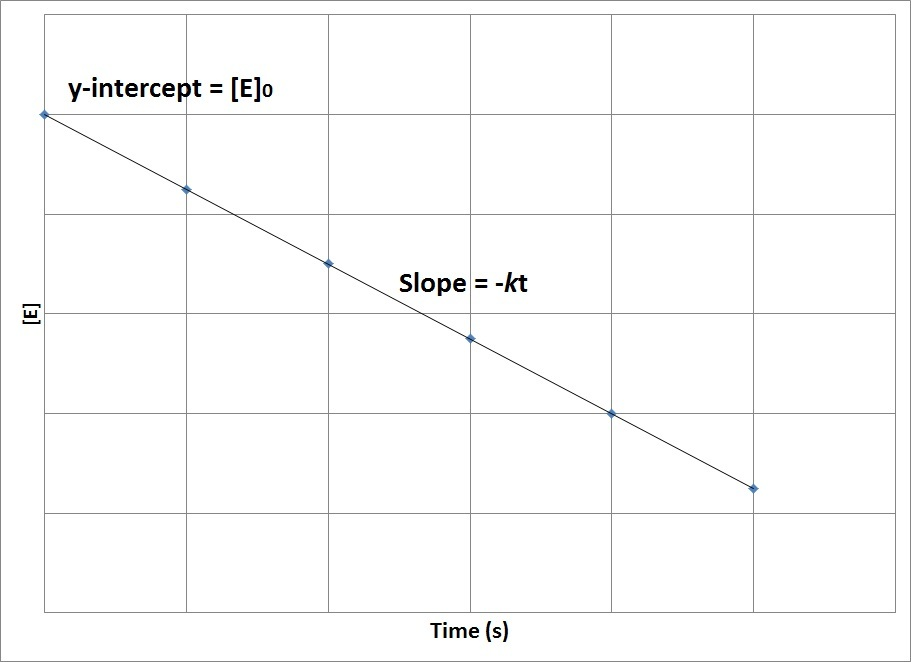
A straight-line concentration–time graph indicates zero-order kinetics, where the rate remains constant throughout the reaction. Source
Because the gradient does not change, the rate can be measured anywhere on the graph and will be the same.
Half-Life in Zero-Order Reactions
Half-life is the time taken for the concentration of a reactant to halve.
Half-life: The time required for the concentration of a reactant to decrease to half its initial value.
For zero-order reactions:
The half-life is not constant.
Each successive half-life becomes shorter as the reaction proceeds.
This is because the rate is constant, but the amount needing to react halves each time.
This non-constant half-life is a key diagnostic feature when interpreting concentration–time graphs.
Identifying First-Order Reactions
In a first-order reaction, the rate is directly proportional to the concentration of the reactant. This relationship leads to a curved concentration–time graph.
Key features of first-order concentration–time graphs:
A curved line that becomes less steep over time.
The gradient decreases as concentration decreases.
The reaction slows continuously but never truly reaches zero concentration.
At high concentrations, the gradient is steep, indicating a fast rate. As the reactant is used up, the gradient becomes shallower.
Half-Life in First-Order Reactions
A defining property of first-order reactions is a constant half-life, regardless of the starting concentration.
For a first-order reaction, the half-life is constant, so the concentration halves in equal time intervals.
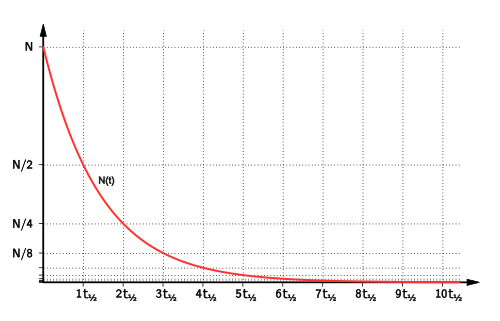
Equal time intervals on an exponential decay curve illustrate the constant half-life characteristic of first-order reactions. Source
Important observations:
Each halving of concentration takes the same amount of time.
This applies throughout the reaction.
Constant half-life is strong evidence for first-order behaviour.
This property is often easier to identify from data than directly analysing gradients.
First-order half-life (t₁⁄₂) = 0.693 / k
k = rate constant (s⁻¹)
t₁⁄₂ = half-life (s)
A constant half-life reflects the fact that although the rate decreases, the proportion of reactant reacting per unit time remains the same.
Using Graph Shape to Deduce Reaction Order
Concentration–time graphs allow reaction order to be deduced qualitatively without calculations.
Summary of visual cues:
Straight line → zero-order reaction
Curved line with constant half-life → first-order reaction
Students must be able to:
Recognise graph shapes.
Link shape to rate behaviour.
Use half-life data to support conclusions.
The ability to interpret these graphs is essential for analysing experimental kinetic data.
Practical Considerations When Interpreting Graphs
Experimental concentration–time data may not always produce perfectly smooth graphs. Minor irregularities can arise due to:
Measurement uncertainty
Temperature fluctuations
Sampling delays
When interpreting such graphs:
Use a best-fit smooth curve.
Draw tangents carefully.
Avoid using early-time data affected by mixing delays.
Only gradients taken from well-defined sections of the curve should be used to determine rates.
Relationship Between Rate, Gradient, and Time
As reactions proceed:
Rate changes with time unless the reaction is zero-order.
This change is reflected directly in the changing gradient of the graph.
Concentration–time graphs therefore provide both instantaneous and overall kinetic information.
Understanding how rate evolves during a reaction helps connect graphical data with underlying kinetic principles, reinforcing the link between experimental observations and reaction order.
Practice Questions
A student studies the decomposition of a reactant and plots a concentration–time graph. The graph is a straight line with a constant negative gradient.
State the order of the reaction and explain how the graph supports your answer.
(2 marks)
Correctly identifies the reaction as zero order (1 mark)
Explains that the straight-line graph or constant gradient shows a constant rate independent of concentration (1 mark)
The concentration–time graph for a reaction shows a smooth curve that becomes less steep as time increases. Measurements show that the concentration of the reactant halves in equal time intervals throughout the reaction.
a) Identify the order of the reaction.
b) Explain how the shape of the concentration–time graph supports this order.
c) Explain what is meant by the term half-life and how its behaviour in this reaction confirms the order.
(5 marks)
a)
Correctly identifies the reaction as first order (1 mark)
b)
States that the graph is curved rather than a straight line (1 mark)
Explains that the decreasing gradient shows the rate decreases as concentration decreases (1 mark)
c)
Correct definition of half-life as the time taken for the concentration of a reactant to halve (1 mark)
Explains that equal half-life intervals are characteristic of first-order reactions (1 mark)
FAQ
In first-order reactions, the rate is proportional to the remaining concentration of the reactant. As the concentration decreases, the rate becomes slower but never reaches zero.
This means the reactant is continually consumed in smaller amounts over time, producing a curve that approaches zero asymptotically rather than reaching it exactly.
Small fluctuations in data can significantly alter the gradient of a tangent, especially at later times when the curve is shallow.
To reduce this effect:
Use a smooth best-fit curve rather than joining points
Avoid drawing tangents near irregular data points
Take gradients over a sufficiently large scale
Gradients require accurate tangents, which can be difficult to draw consistently.
Half-life is easier to identify because:
It relies on concentration values rather than slopes
Equal time intervals can be checked directly from data
It is less affected by small measurement errors
From concentration–time graphs alone, it is difficult to distinguish first-order from second-order reactions reliably.
Both produce curved graphs, so additional methods such as rate–concentration data or integrated rate plots are required to confirm the reaction order.
For reactants, concentration decreases as the reaction proceeds, giving a downward-sloping graph and a negative gradient.
For products, concentration increases with time, so the graph slopes upwards and the gradient is positive, although the numerical value of the rate is still treated as positive in calculations.
