
OCR Specification focus:
‘Investigate rates by initial rates and continuous monitoring, including colorimetry, to generate kinetic data.’
Chemical reaction rates can be measured experimentally using practical techniques that monitor changing quantities, allowing kinetic data to be collected, analysed, and linked to reaction mechanisms.
Purpose of Practical Rate Measurements
Practical methods for measuring rates are designed to generate quantitative kinetic data by tracking how a measurable property changes as a reaction proceeds. These methods allow chemists to determine how fast a reaction occurs under controlled conditions and how rate depends on concentration.
Rate measurements are central to:
Determining reaction order
Comparing reaction speeds
Supporting rate equations and mechanisms
Investigating factors such as concentration and temperature
To be valid, measurements must be accurate, reproducible, and directly related to reactant consumption or product formation.
Two Broad Approaches to Measuring Rates
There are two main experimental strategies used at A-Level:
Initial Rates Method
This approach measures the rate at the very start of the reaction, before concentrations change significantly.
Continuous Monitoring Method
This approach follows the reaction throughout its progress, collecting data over time.
Both methods are explicitly required by the OCR specification and are suited to different experimental contexts.
Initial Rates Method
The initial rates method involves measuring how quickly a reaction begins under different starting conditions.
Initial rate: The rate of reaction measured at the very start of a reaction, when reactant concentrations have not yet changed.
The method is particularly useful for:
Comparing rates at different initial concentrations
Determining reaction order with respect to a reactant
Avoiding complications from reverse reactions or product buildup
Practical Implementation
Initial rates can be measured by:
Recording the time taken for a small, fixed change to occur
Measuring an initial gradient from a concentration–time graph
Using a property that changes rapidly at the start of the reaction
Common measurable changes include:
Volume of gas produced
Mass loss as gas escapes
Colour intensity (using colorimetry)
pH changes, if appropriate
Only the earliest part of the reaction data is used, ensuring reliability of comparisons.
Continuous Monitoring of Reaction Progress
Continuous monitoring involves following the reaction over time and recording how a physical or chemical property changes continuously.
Continuous monitoring: A method of measuring reaction rate by tracking a changing property throughout the course of the reaction.
This method allows:
Construction of concentration–time graphs
Determination of rates at different times
Measurement of half-life for suitable reactions
Key Requirements for Continuous Monitoring
The chosen property must:
Change smoothly and measurably during the reaction
Be directly related to reactant or product concentration
Be recorded accurately and at regular intervals
Common Properties Used in Continuous Monitoring
Several measurable properties are suitable for rate studies at A-Level:
Volume of Gas
Suitable for reactions producing a gas
Gas volume is measured using a gas syringe
Rate is related to gradient of volume–time graph
For gas-producing reactions, connect the flask to a gas syringe and record the gas volume at fixed times to obtain rate data.
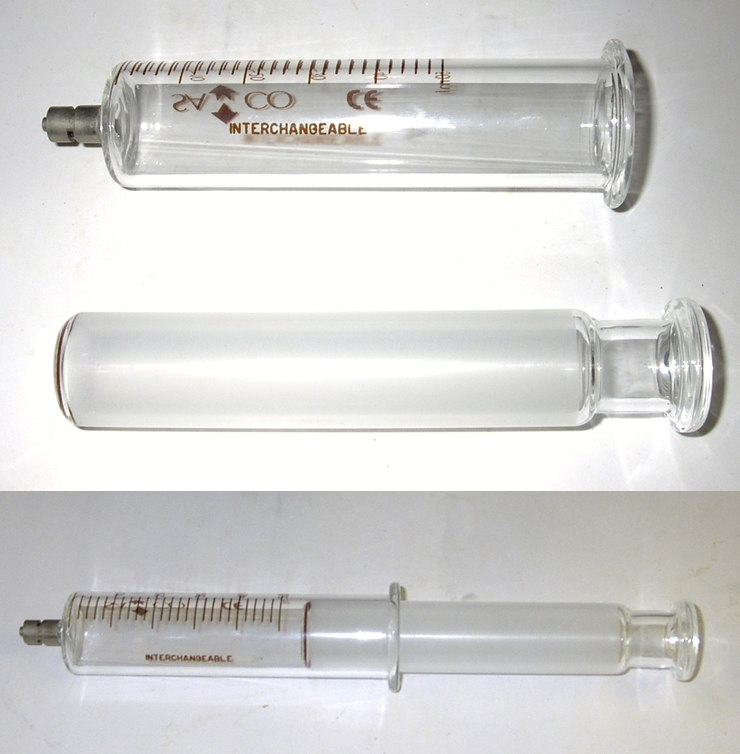
This photograph shows a laboratory gas syringe used to collect and measure gas volume during a reaction. Volume readings taken at regular intervals allow reaction rate data to be generated from volume–time measurements. Source
Mass Change
Used when gas escapes from the reaction vessel
Mass decreases as gaseous products leave
Requires an electronic balance with sufficient precision
Colour Change and Colorimetry
Colorimetry is explicitly named in the OCR specification and is a key technique.
Colorimetry: An analytical technique that measures the intensity of coloured solutions by determining how much light is absorbed.
Colorimetry is particularly useful when:
A reactant or product is coloured
Colour intensity changes steadily with concentration
Direct concentration measurement is difficult
Use of a Colorimeter in Rate Experiments
A colorimeter works by passing light of a fixed wavelength through a solution and measuring absorbance.
Absorbance: A measure of how much light is absorbed by a solution, proportional to the concentration of a coloured species.
In rate experiments:
Absorbance is recorded at regular time intervals
Absorbance values are used as a proxy for concentration
A graph of absorbance against time is plotted
A colourimeter passes light of a chosen wavelength through a cuvette and measures how much is absorbed, producing an absorbance value that can be tracked over time.
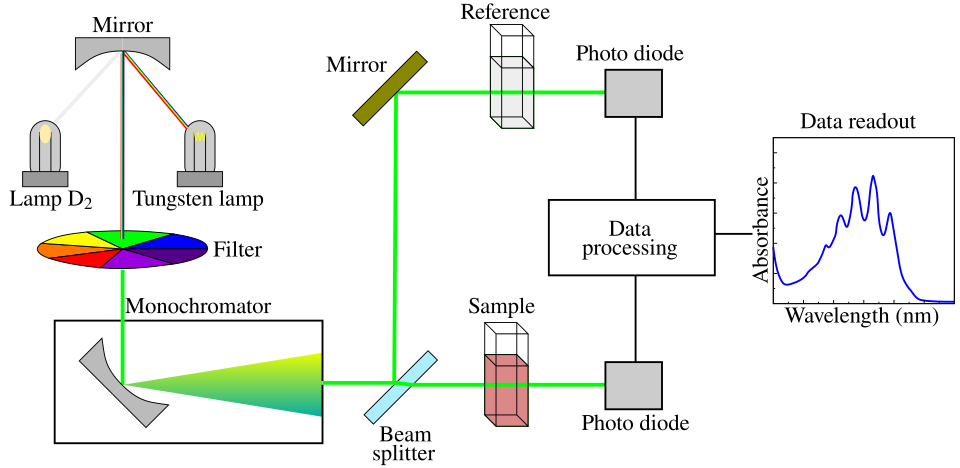
This schematic illustrates how light is selected, passed through a sample cuvette, and detected in a spectrophotometer. Although it includes features beyond a basic school colorimeter, the core measurement principles are the same. Source
The initial gradient of this graph can be used to determine the initial rate.
Important practical considerations include:
Using a blank solution for calibration
Selecting an appropriate filter wavelength
Keeping path length and volume constant
Generating and Using Kinetic Data
All practical methods aim to produce quantitative kinetic data suitable for analysis.
Kinetic data: Experimental measurements that describe how the rate of a chemical reaction changes with time or conditions.
Collected data can be used to:
Compare rates under different conditions
Identify trends between rate and concentration
Support conclusions about reaction behaviour
Accuracy depends on:
Precise timing
Consistent temperature
Reproducible measurement techniques
Errors often arise from:
Delayed mixing
Inconsistent observation timing
Instrumental limitations
Choice of Method and Experimental Design
The choice between initial rates and continuous monitoring depends on:
Speed of the reaction
Nature of reactants and products
Available equipment
Clarity of measurable change
In continuous monitoring, a colourimeter can record absorbance at regular time intervals so concentration changes can be followed throughout the reaction.
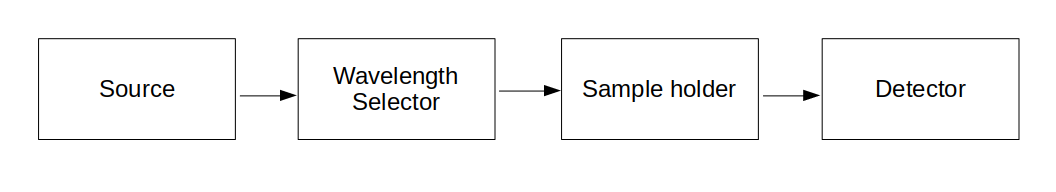
This block diagram summarises the essential components of a colourimeter or spectrophotometer used in kinetics experiments. Each stage shows how light is processed to produce absorbance readings that can be monitored over time. Source
Fast reactions favour initial rates, while slower reactions are better suited to continuous monitoring. Colorimetry is especially valuable where visual observation alone would be subjective.
Careful experimental design ensures that the collected data are meaningful, reliable, and aligned with the requirements of OCR A-Level Chemistry.
Practice Questions
A student investigates the rate of a reaction using a colorimeter.
State two reasons why colorimetry is suitable for continuous monitoring of this reaction.
(2 marks)
Award one mark for each correct point.
Measures absorbance which is related to concentration of a coloured reactant or product. (1 mark)
Allows measurements to be taken at regular time intervals throughout the reaction. (1 mark)
Acceptable alternatives:
Provides quantitative data suitable for plotting absorbance–time graphs.
Avoids subjective judgement of colour change.
A reaction produces a gas and is investigated using a gas syringe.
a) Describe how the rate of this reaction can be measured using the gas syringe method. (3 marks)
b) State two advantages of using continuous monitoring rather than an initial rates method for this reaction. (2 marks)
(5 marks)
a) Measuring rate using a gas syringe (3 marks)
Award marks as follows:
Reaction is set up in a sealed flask connected to a gas syringe. (1 mark)
Volume of gas produced is measured at regular time intervals. (1 mark)
Rate is determined from the change in gas volume per unit time or from the gradient of a volume–time graph. (1 mark)
b) Advantages of continuous monitoring (2 marks)
Award one mark for each valid advantage.
Allows the rate to be measured at different times during the reaction. (1 mark)
Enables a full volume–time graph to be plotted. (1 mark)
Acceptable alternatives:
Suitable for slower reactions.
Provides more data points, improving reliability.
FAQ
The choice depends on what changes can be measured reliably during the reaction.
Key considerations include:
Whether a gas is produced, allowing gas volume or mass loss to be measured
Whether a reactant or product is coloured, making colorimetry suitable
The speed of the reaction, as very fast reactions favour initial rates
Safety, available equipment, and ease of data collection are also important factors.
Reaction rate is very sensitive to temperature, so small fluctuations can significantly affect results.
To ensure reliable data:
Reactions should be carried out in the same environment
Solutions should be allowed to reach room temperature before mixing
Poor temperature control can lead to inconsistent kinetic data and unreliable comparisons between experiments.
At the start of a reaction, concentrations are closest to their known initial values.
This means:
The measured rate is less affected by concentration changes
Side reactions or reverse reactions are less significant
Early data points are therefore especially useful for comparing how rate depends on starting conditions.
Several factors can introduce error when using a gas syringe.
Common issues include:
Gas leaks from loose connections
Friction in the syringe plunger affecting smooth movement
Delays in starting the timer after mixing reactants
Careful setup and consistent technique help minimise these errors.
A blank solution is used to correct for light absorbed by the solvent and the cuvette.
This ensures that:
Absorbance readings are due only to the reacting species
Measurements are comparable between experiments
Without a blank, absorbance values would be artificially high, reducing the accuracy of kinetic data.
