
OCR Specification focus:
‘From rate–concentration data, determine order (0, 1 or 2) and obtain k from the gradient for first-order reactions.’
This topic explains how chemists use experimental rate–concentration data to determine reaction order, interpret graphs, and extract rate constants from initial rate measurements.
Understanding Rate–Concentration Graphs
Rate–concentration graphs show how the rate of reaction changes as the concentration of a reactant changes, while other variables remain constant. These graphs are central to determining the order of reaction with respect to a particular reactant.
Rate of reaction: The change in concentration of a reactant or product per unit time, typically measured in mol dm⁻³ s⁻¹.
A rate–concentration graph plots rate (y-axis) against concentration (x-axis). The shape of this graph provides direct evidence of how rate depends on concentration.
To generate reliable data for such graphs, chemists use the initial rates method, which focuses on measurements taken at the very start of a reaction.
Initial Rates Method
The initial rate is the rate measured immediately after a reaction begins, before concentrations change significantly. Using initial rates ensures that the measured rate corresponds closely to the stated starting concentrations.
Initial rate: The rate of reaction measured at the start of the reaction, when reactant concentrations are known and have not yet changed appreciably.
Initial rates are obtained by:
Measuring a change that is directly related to concentration (e.g. gas volume, colour intensity).
Taking the gradient at time zero from a concentration–time graph.
Repeating the experiment with different initial concentrations of one reactant while keeping others constant.
This method allows the effect of one reactant’s concentration on rate to be isolated clearly.
Identifying Reaction Order from Graph Shape
The order of reaction with respect to a reactant describes how the rate depends on that reactant’s concentration.
Order of reaction: The power to which a reactant’s concentration is raised in the rate equation, determined experimentally.
Zero Order Reactions
For a zero order reaction with respect to a reactant:
Rate is independent of concentration.
The rate–concentration graph is a horizontal straight line.
Changing concentration has no effect on rate.
This behaviour is often seen when a catalyst surface is saturated.
First Order Reactions
For a first order reaction:
Rate is directly proportional to concentration.
The rate–concentration graph is a straight line through the origin.
Doubling concentration doubles the rate.
This linear relationship is particularly important because it allows the rate constant to be obtained from the graph.
Second Order Reactions
For a second order reaction:
Rate is proportional to the square of concentration.
The rate–concentration graph is curved, becoming steeper at higher concentrations.
Doubling concentration increases the rate by a factor of four.
From rate–concentration data, determine order (0, 1 or 2) and obtain k from the gradient for first-order reactions.
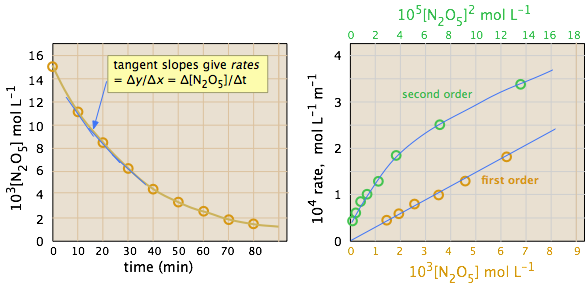
Rate–concentration behaviour distinguishes reaction order. A straight-line relationship indicates first-order kinetics, while curvature indicates second-order behaviour derived from initial rate measurements. Source
OCR A-Level Chemistry limits required analysis to identifying 0, 1, or 2 order behaviour from these graphical features.
The Rate Equation and Rate Constant
Experimental results from initial rates experiments are summarised using a rate equation.
Rate constant (k): A proportionality constant in the rate equation that depends on temperature and the nature of the reaction, with units determined by overall order.
Rate equation
Rate = k[A]ⁿ
Rate = rate of reaction (mol dm⁻³ s⁻¹)
k = rate constant (units depend on order)
[A] = concentration of reactant A (mol dm⁻³)
n = order with respect to A
The value of n is not obtained from the balanced equation but from experimental rate–concentration data.
Determining Order Using Rate–Concentration Data
Order can be determined by:
Inspecting the shape of the rate–concentration graph.
Comparing how rate changes when concentration is increased by a known factor.
Key indicators:
No change in rate → zero order
Proportional change → first order
Squared relationship → second order
Graphical interpretation is preferred at OCR A-Level, rather than logarithmic plots.
Obtaining the Rate Constant from a First-Order Graph
For first order reactions only, the rate constant can be obtained directly from the gradient of a rate–concentration graph.
Gradient method for first-order reactions
Gradient = k
k = rate constant (s⁻¹)
This works because:
Rate = k[A]
Rearranging gives rate/[A] = k
On a rate vs concentration graph, gradient = Δrate / Δ[A] = k
The straight-line graph must pass through the origin for this method to be valid.
Experimental Considerations and Accuracy
When interpreting rate–concentration graphs:
Ensure only one reactant concentration changes at a time.
Temperature must be kept constant, as k depends on temperature.
Initial rates should be used to avoid complications from changing concentrations.
The initial rate is taken at t = 0, before concentrations have changed significantly.
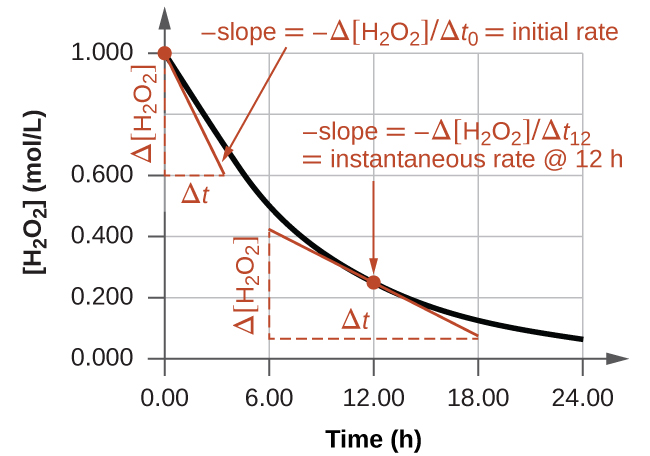
The initial rate is obtained from the gradient of the tangent at time zero on a concentration–time graph. Later tangents illustrate instantaneous rate, reinforcing the gradient concept used in initial rate analysis. Source
Common experimental measurements linked to rate include:
Gas volume produced per second
Change in mass per second
Change in absorbance per second (via colorimetry)
Accurate identification of order and correct extraction of k rely on precise initial measurements and careful graphical analysis, aligning directly with OCR specification requirements.
Practice Questions
The rate of a reaction is measured at several different initial concentrations of reactant A.
A graph of rate against concentration of A is a straight line passing through the origin.
(a) State the order of reaction with respect to A.
(b) State how the rate changes when the concentration of A is doubled.
(2 marks)
(a) First order
1 mark for correctly stating first order.
(b) The rate doubles
1 mark for stating that doubling the concentration doubles the rate.
A reaction between substances X and Y is studied using the initial rates method. The concentration of X is varied while the concentration of Y is kept constant.
(a) Explain why initial rates are used when determining the order of reaction.
(b) The graph of rate against concentration of X is a curve that becomes steeper at higher concentrations. Deduce the order of reaction with respect to X and explain your reasoning.
(c) State how the rate constant k could be obtained if the reaction were first order with respect to X.
(5 marks)
(a) Any one of:
Concentrations have not changed significantly at the start of the reaction
Rate corresponds directly to known starting concentrations
Avoids complications from changing concentrations during the reaction
1 mark for a correct explanation.
(b) Second order with respect to X
Correctly states second order (1 mark)
Explains that rate increases more than proportionally with concentration / curved rate–concentration graph / rate proportional to [X] squared (1 mark)
(c) Any one of:
Plot rate against concentration of X and calculate the gradient
The gradient of the straight-line rate–concentration graph equals k
1 mark for a correct statement.
Total: 5 marks
FAQ
Keeping other reactant concentrations constant ensures that any change in rate is caused solely by the reactant being investigated.
If multiple concentrations change at once, it becomes impossible to isolate the effect of a single reactant on the rate. This would prevent a clear determination of the reaction order with respect to that reactant.
If the reaction is first order, rate is directly proportional to concentration.
When concentration is zero, no successful collisions can occur, so the rate must also be zero. A straight line through the origin confirms this proportional relationship and validates the use of the gradient to find the rate constant.
Several factors can cause deviations from the expected graph shape:
Temperature changes during the experiment
Inaccurate or inconsistent timing when measuring initial rates
Delays in starting measurements after mixing reactants
Instrument limitations, such as slow sensor response
Controlling these factors is essential for reliable rate–concentration data.
In second-order reactions, the relationship between rate and concentration is not linear.
Because the rate–concentration graph is curved, there is no constant gradient. As a result, k cannot be obtained directly from the graph and must be calculated using alternative methods.
Small uncertainties in measured rate or concentration can significantly affect conclusions, especially when distinguishing between first and second order.
For example, experimental scatter may make a slightly curved graph appear linear. Repeating experiments and using a wide range of concentrations reduces the risk of assigning an incorrect order.
