
OCR Specification focus:
‘Sketch and interpret I–V curves for resistor, filament lamp, thermistor, diode, and LED.’
Understanding current–voltage (I–V) characteristics is essential to analysing how different components behave in electrical circuits. These relationships reveal whether a component obeys Ohm’s law and help predict how current responds to changes in potential difference.
Understanding I–V Characteristics
Definition and Concept
I–V Characteristic: The relationship between the current (I) through a component and the potential difference (V) across it, typically shown on a graph.
An I–V graph provides insight into how a component conducts electricity. A straight-line graph through the origin indicates a proportional relationship between current and potential difference, while a curved graph indicates non-linear or non-ohmic behaviour.
Ohmic Conductors
Ohm’s Law
Ohm’s Law: The current through a conductor is directly proportional to the potential difference across it, provided the temperature and physical conditions remain constant.
EQUATION
—-----------------------------------------------------------------
Resistance (R) = V ÷ I
R = Resistance (ohms, Ω)
V = Potential difference (volts, V)
I = Current (amperes, A)
—-----------------------------------------------------------------
An ohmic conductor follows Ohm’s law, displaying a constant resistance. This means the ratio V/I remains the same for any applied voltage within the valid range. A graph of I versus V for an ohmic conductor is a straight line through the origin, indicating uniform conductivity.

Straight-line I–V graph for an ohmic resistor. Current is proportional to potential difference, so the gradient is constant and the resistance R = V/I is the same at all points. This directly exemplifies Ohm’s law at constant temperature. Source.
Metal Wire as an Example
A typical metal wire at constant temperature demonstrates ohmic behaviour.
As voltage increases, current increases proportionally.
If the wire heats up, resistance rises slightly, and the graph may begin to curve due to temperature effects altering atomic vibrations.
Maintaining a constant temperature is therefore critical when investigating ohmic components experimentally.
Non-Ohmic Conductors
Characteristics
Non-ohmic components do not obey Ohm’s law. Their resistance varies with changes in voltage, current, or environmental conditions such as temperature and light intensity. Their I–V graphs are non-linear, showing that current is not directly proportional to potential difference.
The Filament Lamp
A filament lamp provides a clear example of non-ohmic behaviour.
At low voltages, the current increases almost linearly with voltage.
As current increases, the filament’s temperature rises, increasing its resistance.
This causes the graph to curve and flatten, showing that less current flows for each additional volt applied.
Key feature: Resistance increases with temperature because higher kinetic energy in the metal atoms increases electron collisions, impeding charge flow.
Thermistors
Temperature-Dependent Resistors
A thermistor is a resistor whose resistance changes significantly with temperature.
NTC Thermistor (Negative Temperature Coefficient): A thermistor in which resistance decreases as temperature increases.
At low temperatures, the thermistor has high resistance, and current flow is limited.
As temperature rises, more charge carriers become available, reducing resistance and allowing greater current for a given voltage.
The I–V curve for an NTC thermistor curves steeply upward as voltage increases, showing a rapid increase in current due to thermal effects.
Practical applications: Thermistors are used in temperature sensors, inrush current limiters, and thermostatic controls due to their predictable response to temperature changes.
Diodes
Directional Conduction
A diode is a semiconductor device that allows current to flow in one direction only.
Diode: An electronic component that conducts current primarily in one direction (forward bias) and blocks it in the reverse direction (reverse bias).
In the forward bias, once the threshold voltage (typically about 0.6–0.7 V for a silicon diode) is reached, current increases sharply for small increases in voltage. In the reverse bias, current remains negligible until breakdown voltage is reached, at which point current rises rapidly, potentially damaging the diode.
The I–V characteristic for a diode:
Flat near zero in reverse bias (almost no current).
Sharp exponential rise after threshold in forward bias.
Light-Emitting Diodes (LEDs)
Electrical and Optical Properties
A light-emitting diode (LED) behaves similarly to a regular diode but emits visible or infrared light when current flows in the forward direction.
The I–V graph resembles that of a diode, with a distinct threshold voltage (typically between 1.6 V and 3.0 V depending on colour).
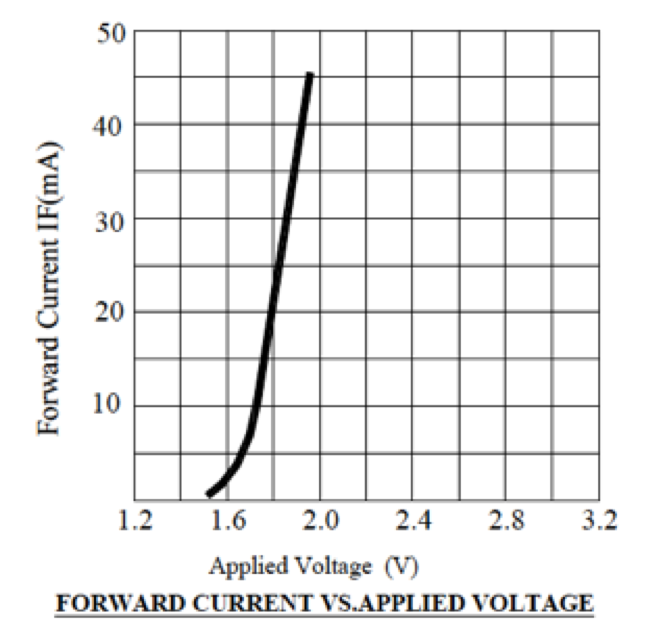
I–V curve for a red LED showing negligible current below the threshold and a steep increase in forward bias. This highlights diode-like rectification and the colour-dependent turn-on voltage. (The page also discusses load lines—useful context but not required by the syllabus.) Source.
Beyond this voltage, current increases rapidly and light emission begins.
LEDs are highly efficient, converting electrical energy directly into light without heating a filament.
Note: LEDs must always be used with a current-limiting resistor to prevent excessive current that could cause damage.
Comparing Ohmic and Non-Ohmic Behaviour
Summary of Key Differences
Ohmic conductors: Constant resistance, linear I–V graph, obey Ohm’s law.
Non-ohmic conductors: Variable resistance, non-linear I–V graphs, do not obey Ohm’s law.
The slope (gradient) of the I–V curve indicates resistance—steeper gradients mean lower resistance.
Practical Interpretation of I–V Curves
To interpret I–V curves effectively:
Identify whether the line is straight (ohmic) or curved (non-ohmic).
Assess symmetry: diodes and LEDs conduct in one direction only.
Observe how resistance changes with voltage—if it increases, the slope flattens (as in a filament lamp); if it decreases, the slope steepens (as in a thermistor).
These interpretations allow physicists and engineers to select appropriate components for circuits, ensuring predictable performance across varying conditions.
Practice Questions
Question 1 (2 marks)
A student plots an I–V graph for a component and obtains a straight line through the origin.
(a) State what this indicates about the relationship between current and potential difference. (1 mark)
(b) Name one component that would show this type of I–V characteristic under constant conditions. (1 mark)
Mark Scheme for Question 1
(a)
Current is directly proportional to potential difference. (1 mark)
(b)
Correct example such as resistor or metal wire at constant temperature. (1 mark)
Question 2 (5 marks)
The graph below shows the I–V characteristics for two components: a filament lamp and a diode.
(a) Explain why the I–V curve for a filament lamp becomes shallower as the potential difference increases. (2 marks)
(b) Describe and explain the main features of the I–V characteristic for a diode. (3 marks)
Mark Scheme for Question 2
(a)
As potential difference increases, current increases and the filament becomes hotter. (1 mark)
Increased temperature causes the resistance of the filament to rise, reducing the rate of current increase and producing a curve that flattens. (1 mark)
(b)
In forward bias, current remains very small until a threshold (typically 0.6–0.7 V for silicon) is reached. (1 mark)
Beyond the threshold, current increases rapidly for a small increase in potential difference. (1 mark)
In reverse bias, current is almost zero until breakdown voltage is reached, when current suddenly increases. (1 mark)
FAQ
As the current increases, the metal filament becomes hotter due to electrical energy being converted into heat. The rising temperature causes metal ions in the filament to vibrate more vigorously, which increases the frequency of collisions between the free electrons and the lattice ions.
This greater collision rate opposes electron flow, meaning the resistance increases with temperature. This explains the curved, flattening I–V graph for a filament lamp.
Slow measurements allow time for the component, especially thermally sensitive ones such as filament lamps and thermistors, to reach thermal equilibrium.
If the potential difference is changed too rapidly, temperature fluctuations can distort the data by altering resistance before stabilisation occurs.
To improve accuracy:
Increase voltage in small steps.
Allow the current and temperature to settle before recording readings.
Repeat readings to check consistency.
Both devices conduct in one direction, but the LED begins to conduct at a slightly higher threshold voltage (1.6–3.0 V depending on colour) than a silicon diode (around 0.6–0.7 V).
In an LED, the forward current causes electrons to recombine with holes, releasing energy as light photons rather than heat.
Different semiconductor materials produce different wavelengths of light, so threshold voltage and colour are directly linked.
As voltage increases, the thermistor warms due to electrical energy dissipation. The rising temperature releases more charge carriers (electrons), drastically lowering the resistance.
This means a greater current flows for the same voltage increase, creating a steep upward curve on the I–V graph.
The process continues until the thermistor reaches a point of self-heating balance, beyond which the rate of current increase stabilises.
Use a low-voltage d.c. power supply to prevent excessive current or component damage.
Include a variable resistor to control current flow.
Use accurate digital meters for voltage and current to reduce measurement uncertainty.
Switch off the circuit between readings for thermally sensitive components (e.g. lamps, thermistors) to allow cooling.
These precautions ensure safe operation, minimise heating effects, and improve data reliability when identifying ohmic or non-ohmic behaviour.
