
OCR Specification focus:
‘Plan and carry out experiments to investigate potential dividers with sensors.’
Investigating sensor circuits allows students to understand how potential dividers work in practical systems. This subtopic explores experimental methods, design strategies, and analysis for light- and temperature-dependent circuits.
Investigating Sensor Circuits
This subsubtopic focuses on how potential divider circuits can be used with variable resistive sensors such as LDRs (Light-Dependent Resistors) and thermistors to detect environmental changes. Students are expected to plan, construct, and analyse circuits that demonstrate how a potential difference varies with changing physical conditions. Understanding both the experimental design and measurement accuracy is essential to meeting OCR’s practical and theoretical expectations.
The Role of a Potential Divider
A potential divider distributes the input voltage between two or more resistive components connected in series. By adjusting the ratio of resistances, a specific output voltage can be produced. When one of these components is a sensor whose resistance changes with external conditions, the circuit becomes a useful measurement system.
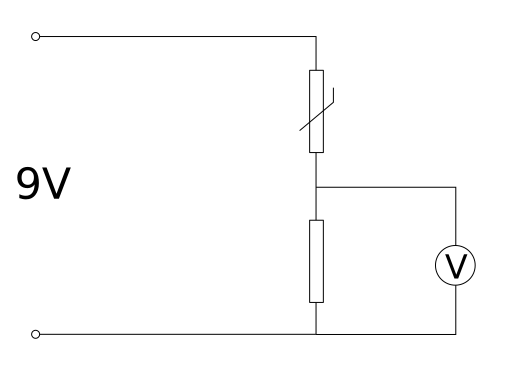
Thermistor potential-divider used for temperature sensing. As temperature rises, the thermistor’s resistance (NTC) falls, changing the junction voltage that serves as the measurement signal. This mirrors the procedure of calibrating output voltage against temperature in an investigation. Source.
Potential Divider: A circuit that divides an input potential difference between two or more resistors connected in series.
The output voltage is taken across one of the resistors and depends on the resistance ratio, allowing it to act as a voltage signal representing the sensor’s environment.
Selecting the Sensor
Two common variable components are used in sensor circuits:
LDR (Light-Dependent Resistor): Resistance decreases as light intensity increases.
Thermistor: Resistance decreases as temperature increases (for a Negative Temperature Coefficient type).
These sensors allow potential divider circuits to act as light sensors or temperature sensors. The choice of component depends on the environmental variable being monitored.
Sensor: A device that detects or measures a physical property and converts it into an electrical signal.
Planning the Investigation
When planning experiments, students must demonstrate understanding of independent, dependent, and control variables:
Independent variable: The physical quantity being changed (e.g. light intensity or temperature).
Dependent variable: The output voltage from the potential divider circuit.
Control variables: Factors such as the supply voltage, component placement, and ambient conditions.
Planning should include:
A labelled circuit diagram showing resistor arrangement and measuring instruments.
Consideration of measurement range to ensure sensor output varies linearly within the tested conditions.
Safe use of power supplies (typically less than 6 V) to avoid overheating or component damage.
Constructing the Circuit
Typical construction steps include:
Connect the sensor in series with a fixed resistor.

Thermistor potential-divider used for temperature sensing. As temperature rises, the thermistor’s resistance (NTC) falls, changing the junction voltage that serves as the measurement signal. This mirrors the procedure of calibrating output voltage against temperature in an investigation. Source.
Connect the series combination across a known input voltage.
Measure the output voltage across one of the components using a voltmeter with high internal resistance to minimise circuit loading.
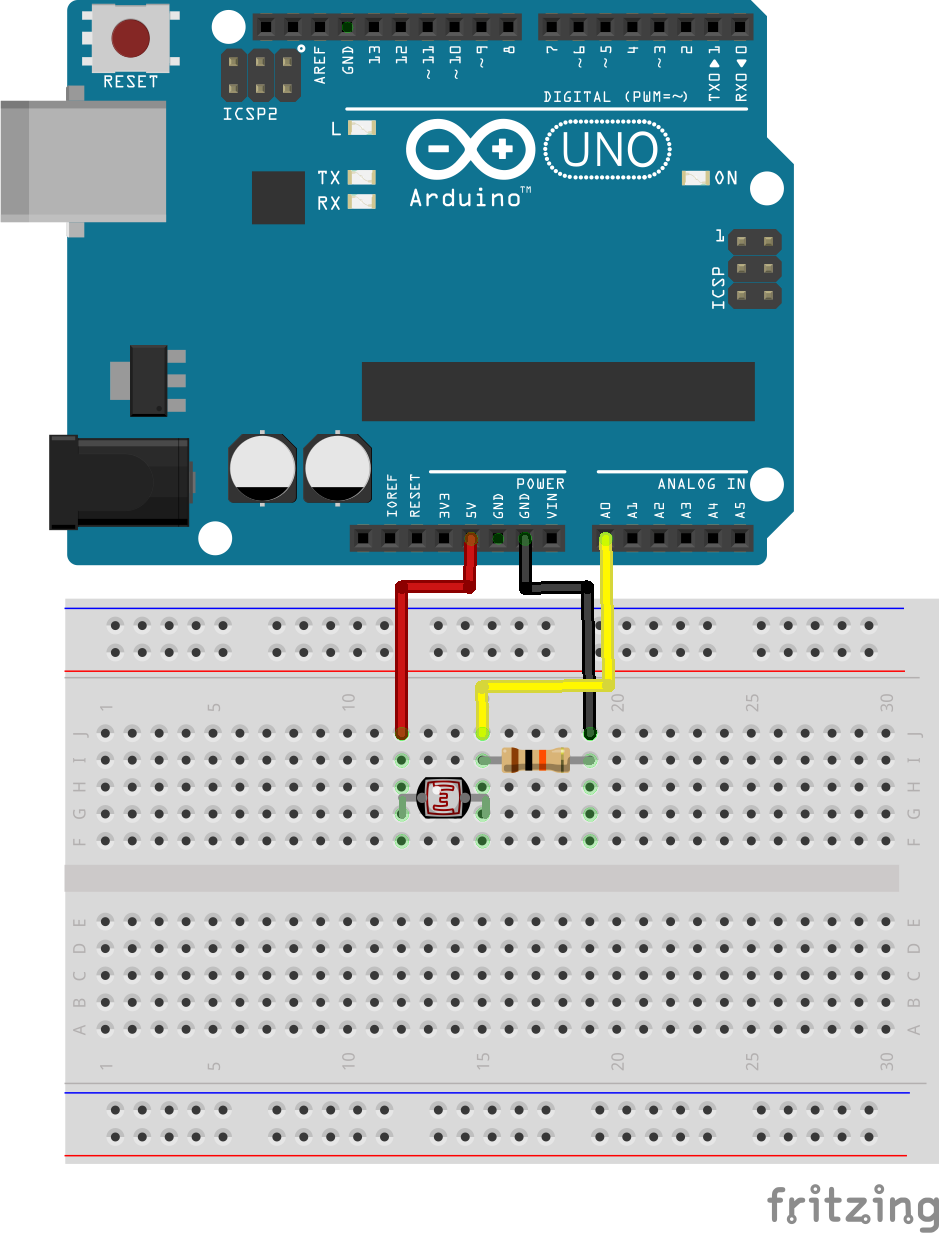
Breadboard implementation of an LDR potential divider with the junction voltage routed to a measurement input. This mirrors measuring Vout while varying the illumination to build a calibration curve. Extra detail: the Arduino provides readout only; any high-impedance voltmeter would serve the same role in OCR investigations. Source.
Adjust environmental conditions (light or temperature) and record the corresponding output voltages.
It is essential that electrical connections are secure, and that wires are kept short to reduce resistance errors.
EQUATION
—-----------------------------------------------------------------
Potential Divider Equation (V_out) = (R₂ / (R₁ + R₂)) × V_in
V_out = Output voltage across resistor R₂ (V)
R₁, R₂ = Resistances of the two series components (Ω)
V_in = Total supply voltage (V)
—-----------------------------------------------------------------
Analysing Experimental Data
Students should record results in a clear table of output voltage versus environmental variable and then plot a suitable graph. For example:
For an LDR, plot V_out against light intensity.
For a thermistor, plot V_out against temperature.
From the plotted data, the relationship between sensor condition and output voltage can be interpreted:
A negative correlation indicates that as the sensor’s resistance decreases, the measured output voltage across it also decreases (typical of an LDR when brighter).
The gradient can reveal sensitivity, indicating how responsive the circuit is to small environmental changes.
EQUATION
—-----------------------------------------------------------------
Sensitivity (S) = ΔV_out / Δx
ΔV_out = Change in output voltage (V)
Δx = Change in environmental variable (e.g. °C or lux)
—-----------------------------------------------------------------
Controlling and Measuring Conditions
Accurate results depend on consistent and measurable environmental control:
For light, use a lamp at varying distances or neutral-density filters.
For temperature, use a thermostatic water bath or a controlled heat source.
Record the environmental variable using a calibrated instrument such as a light meter or thermometer.
Between readings, allow time for the sensor to reach thermal equilibrium or steady illumination to avoid transient effects.
Minimising Experimental Uncertainty
In practical work, attention to measurement precision and equipment limitations ensures reliable results. Techniques include:
Using digital voltmeters with high resolution.
Taking multiple readings at each setting and calculating the mean.
Considering uncertainty propagation, especially when deriving quantities from measured voltages and resistances.
Avoiding excessive current that could alter the sensor’s characteristics through self-heating.
Uncertainty: The range within which the true value of a measured quantity is expected to lie.
Interpreting the Graphical Results
The plotted graph provides experimental insight into circuit behaviour. When analysing data:
Identify linear and non-linear regions to understand sensor characteristics.
Compare theoretical predictions from the potential divider equation with experimental points.
Use best-fit lines to estimate trends and determine how circuit design affects output.
Discuss how tolerance of components or temperature drift might influence results.
These steps ensure a full scientific analysis consistent with OCR’s Required Practical Skills criteria.
Applications of Sensor Investigations
Understanding how to design and test sensor circuits is fundamental for developing control systems and automatic responses. Common applications include:
Automatic lighting using LDRs that trigger when brightness drops below a threshold.
Temperature alarms or thermostats using thermistors to detect overheating.
Feedback systems in which output voltage is used to control another circuit element, such as a transistor switch or relay.
Students should appreciate that experimental design and testing provide the foundation for developing these technologies, combining theoretical physics with real-world engineering contexts.
Evaluating Circuit Design and Method
Evaluation requires assessing both data quality and experimental design choices:
Was the voltage range suitable to show a clear response?
Were resistors chosen appropriately to give measurable output variation?
Were safety and reliability maintained during all measurements?
How could the setup be improved — for instance, by shielding from ambient light or improving temperature uniformity?
Each evaluation point strengthens scientific reasoning and demonstrates understanding of how potential dividers function in practical sensor systems.
Practice Questions
Question 1 (2 marks)
A student builds a potential divider circuit using a fixed resistor and an LDR connected in series across a 6.0 V supply. The output voltage is measured across the LDR.
Describe and explain how the output voltage changes as the light intensity on the LDR increases.
Mark scheme for Question 1
1 mark: States that the output voltage decreases as light intensity increases.
1 mark: Explains that LDR resistance decreases with increasing light, so a smaller proportion of the supply voltage is dropped across it (and more across the fixed resistor).
Question 2 (5 marks)
In an experiment to investigate a potential divider circuit using a thermistor, a student connects the thermistor in series with a fixed resistor across a 5.0 V supply.
The output voltage is measured across the fixed resistor for a range of temperatures from 20 °C to 80 °C.
(a) Describe how the student should carry out this experiment safely and obtain accurate results. (3 marks)
(b) Sketch and explain the expected shape of the graph of output voltage against temperature. (2 marks)
Mark scheme for Question 2
(a) 3 marks total:
1 mark: Describes immersing the thermistor in a controlled temperature environment (e.g. water bath) and measuring temperature with a calibrated thermometer.
1 mark: Mentions using a digital voltmeter with high internal resistance and taking readings after temperature stabilisation.
1 mark: Notes safety considerations such as using low voltage (e.g. 5 V) to avoid overheating or electric shock.
(b) 2 marks total:
1 mark: Correctly states that the output voltage increases as temperature increases.
1 mark: Explains that as the thermistor resistance decreases with temperature, a greater proportion of the supply voltage appears across the fixed resistor.
FAQ
Maintaining consistent light conditions is crucial for accurate results. The light source should be fixed in position and shielded from external variations such as sunlight or reflections.
Use black card tubes or enclosures around the LDR to prevent stray light from altering readings.
If possible, use a bench lamp with adjustable distance to vary intensity systematically.
Record the distance between the lamp and LDR for each trial, and ensure the LDR is not heated by prolonged exposure, which could alter its resistance independently of light intensity.
Real sensors rarely follow perfect theoretical models due to non-linear resistance behaviour, especially at extremes of light or temperature.
Additional factors include:
Manufacturing tolerances in resistors or sensors.
Self-heating effects at higher currents, altering resistance.
Response lag, where the sensor takes time to adjust to new conditions.
Calibration using measured data helps relate the sensor’s actual performance to the theoretical model.
The loading effect occurs when a voltmeter draws current from the circuit, slightly altering the voltage it measures.
To minimise this:
Use a digital voltmeter or data logger with very high internal resistance (typically >10 MΩ).
Avoid connecting additional devices to the same output node during measurement.
Even small loading effects can distort results when dealing with high-resistance sensors like LDRs, especially at low light levels.
Plotting V against I allows direct analysis of circuit behaviour using Ohm’s law and determination of effective resistance of the sensor at each condition.
Advantages include:
Simplifies extraction of resistance using the slope of the graph.
Enables comparison with theoretical potential divider relationships.
Useful for identifying non-linear regions where resistance varies sharply.
However, this approach omits direct environmental correlation, so it should be combined with temperature or light readings for complete analysis.
Reducing uncertainty relies on both instrument precision and experimental technique.
Use a digital voltmeter with a small voltage range (e.g., 0–2 V) for greater resolution.
Take multiple readings and average them to minimise random error.
Maintain stable environmental conditions — avoid flickering light or fluctuating room temperature.
Allow time for the sensor to reach steady state before recording each measurement.
Consistent setup and controlled variables are key to producing reliable, repeatable results.
