
OCR Specification focus:
‘Use prefixes pico to tera, and correct conventions for graph axes and table headings.’
Prefixes and data presentation conventions are essential tools for physicists to express quantities clearly and interpret experimental data accurately. This topic ensures clarity, consistency, and precision across scientific communication.
Understanding S.I. Prefixes
The Need for Prefixes
In physics, quantities can vary enormously — from atomic scales to astronomical distances. S.I. prefixes simplify numbers by expressing them as powers of ten, making values manageable and readable. For instance, rather than writing 0.000001 m, we can write 1 μm (micrometre).
S.I. Prefix: A symbol placed before a unit to indicate multiplication or division by a power of ten.
The Standard Range of Prefixes
For OCR A-Level Physics, students must know prefixes ranging from pico (10⁻¹²) to tera (10¹²). These cover the majority of physical measurements encountered in experimental and theoretical contexts.
Common S.I. Prefixes (pico to tera):
pico (p) = 10⁻¹²
nano (n) = 10⁻⁹
micro (μ) = 10⁻⁶
milli (m) = 10⁻³
centi (c) = 10⁻²
deci (d) = 10⁻¹
kilo (k) = 10³
mega (M) = 10⁶
giga (G) = 10⁹
tera (T) = 10¹²
Importance of Using Correct Prefixes
Using the correct prefix avoids confusion, ensures dimensional consistency, and allows scientists to compare quantities easily. For instance, an instrument calibrated in milliamperes (mA) must be interpreted correctly in relation to amperes (A). Misinterpreting units could lead to errors in calculations, measurements, or conclusions.
Converting Between Prefixes
To convert between prefixes, identify the powers of ten difference between them. Move the decimal point accordingly:
From milli to kilo → 10⁶ difference (×10⁶)
From micro to milli → 10³ difference (÷10³)
Ensure to write the unit symbol clearly with its prefix to maintain scientific accuracy.
Use prefixes from pico to tera, ensuring correct symbols and powers of ten are applied consistently.
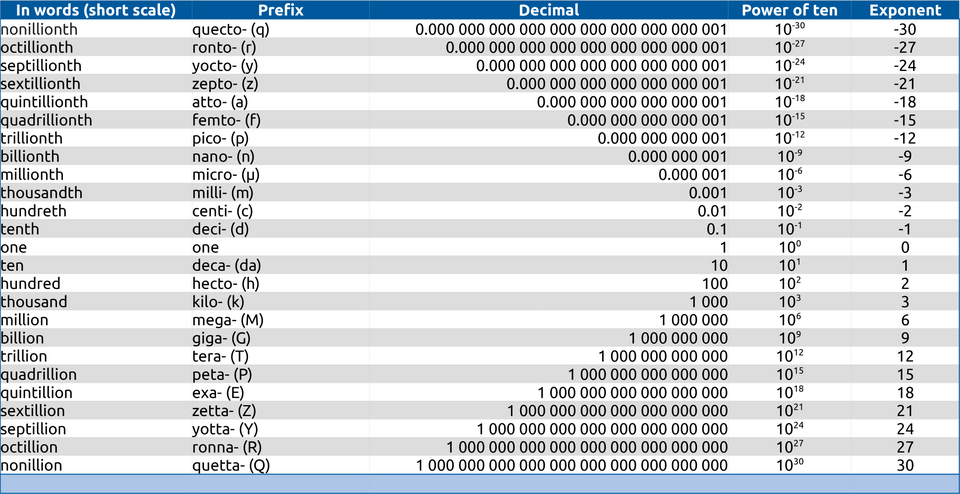
SI prefixes shown from quecto (10⁻³⁰) to quetta (10³⁰) with names, symbols, and powers of ten. This includes prefixes beyond the OCR focus (pico to tera) but provides useful context for understanding scale and notation consistency. Source.
Data Presentation Conventions
The Role of Data Presentation in Physics
Physics relies heavily on data obtained through experiments and observations. Data presentation conventions ensure that results are displayed clearly, allowing patterns and relationships to be interpreted correctly. OCR requires students to follow consistent practices for graph axes, table headings, and units.
Conventions for Tables
Tables are used to record measurements and results in a structured format. Properly formatted tables improve readability and minimise error.
Key conventions include:
Every column should have a heading showing the quantity and its unit in brackets (e.g. Voltage (V), Time (s)).
Units should not appear in individual data entries — only in the column heading.
Measured values should be recorded with an appropriate number of significant figures and decimal places, consistent with the instrument’s precision.
Derived quantities, such as gradients or ratios, must also include correct units in their headings.
Significant Figures: The digits in a number that carry meaning contributing to its measurement accuracy.
Consistency in the presentation of significant figures demonstrates precision and professionalism in reporting data.
Conventions for Graphs
Graphs visually represent relationships between physical quantities. A clear, well-labelled graph communicates trends effectively and is essential for data analysis.
Standard graph conventions:
Independent variable on the x-axis and dependent variable on the y-axis.
Both axes labelled with quantity and unit in brackets, e.g. Force (N), Extension (m).
Use an appropriate scale that spreads data evenly across the grid. Avoid awkward scales that obscure relationships.
Plot data points accurately, using crosses or small dots with circles.
If applicable, draw a line of best fit (straight or curve) that represents the overall trend of the data.
Outliers should be identified but not automatically excluded without justification.
Label both axes with the physical quantity and its unit in parentheses, and include error bars where appropriate.
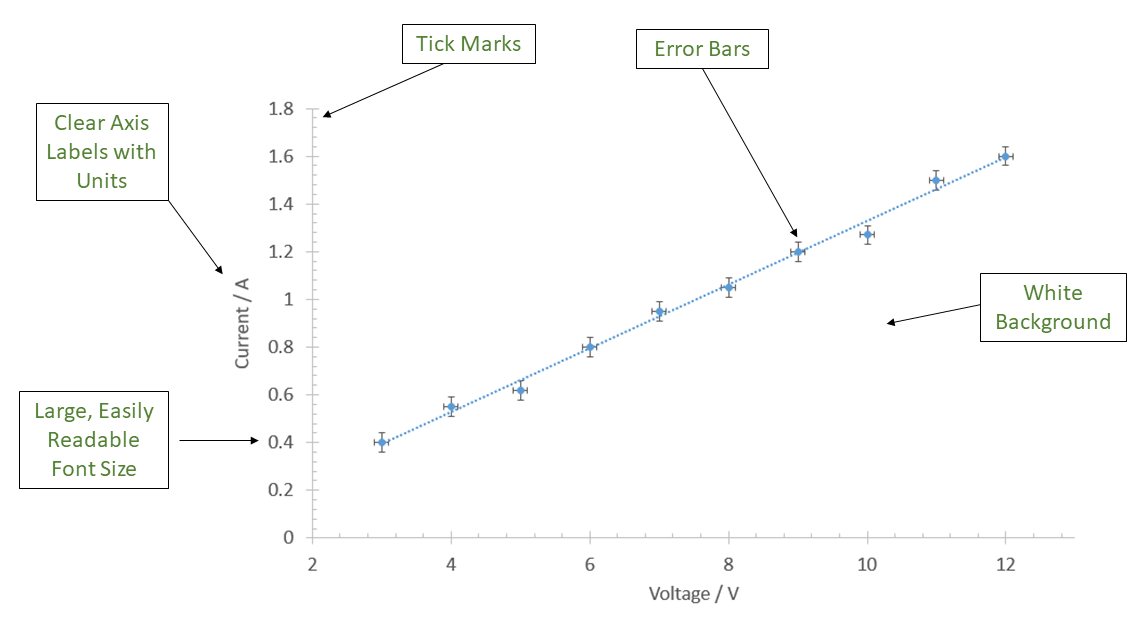
An example of a well-presented scientific graph with axis labels and units (Voltage (V), Current (A)), tick marks, error bars, and a trendline. The annotations highlight essential conventions in physics data presentation without adding extra syllabus content. Source.
Line of Best Fit: A straight or curved line drawn through data points to best represent the underlying relationship between two variables.
Error Bars and Uncertainty Representation
Where appropriate, error bars should be shown to represent measurement uncertainty in the data. These allow readers to visually assess the reliability of the results. Each bar extends one uncertainty value above and below (or left and right of) the mean measurement.
Uncertainty: The range within which the true value of a measurement is expected to lie.
Axes Scales and Units
Scales must increase uniformly, with major gridlines corresponding to sensible intervals. Never break an axis arbitrarily unless clearly indicated. Units should always accompany quantities in both axes’ labels. For logarithmic data, axes should be marked with powers of ten.
Common Mistakes to Avoid
Students often lose marks by neglecting small but important details. Be cautious of the following:
Omitting units from graph axes or table headings.
Mixing prefixes inconsistently (e.g. recording time as both ms and s).
Using too few significant figures in calculated results.
Failing to title graphs or include clear axes labels.
Each of these mistakes reduces clarity and can mislead the interpretation of physical results.
Integrating Prefixes and Presentation in Experimental Work
In practical physics, prefixes and presentation conventions work hand in hand. For example, when measuring a small current of 0.002 A, it is more meaningful to record it as 2 mA in your results table and label the axis as Current (mA). This keeps all data within a manageable numerical range and improves visual interpretation.
EQUATION
—-----------------------------------------------------------------
Conversion Formula: Quantity (with new prefix) = Quantity × 10ⁿ
Quantity = Numerical value of the measurement
n = Power of ten difference between prefixes
—-----------------------------------------------------------------
This simple conversion allows uniformity across datasets, ensuring that both tables and graphs remain easy to interpret. Consistency between prefixes, units, and recorded data is a hallmark of professional scientific reporting.
In essence, accurate use of S.I. prefixes and adherence to data presentation conventions are cornerstones of reliable physics practice. They promote clarity, comparability, and the effective communication of scientific findings — all of which are essential for success in OCR A-Level Physics and beyond.
Practice Questions
Question 1 (2 marks)
A student records the time for a pendulum to complete one oscillation as 0.0045 s. Express this time using an appropriate S.I. prefix.
Mark scheme:
1 mark for recognising that 0.0045 s = 4.5 × 10⁻³ s.
1 mark for using the correct prefix milli, giving the final answer 4.5 ms.
Question 2 (5 marks)
An experiment is carried out to investigate the relationship between the current through a resistor and the potential difference across it. The student records the data and plots a graph of current (A) on the y-axis and potential difference (V) on the x-axis.
(a) State two features that must be included on both axes of the graph to meet standard data presentation conventions. (2 marks)
(b) Explain why using consistent S.I. prefixes and units throughout the graph and data table is important for clarity and accuracy. (2 marks)
(c) The student forgets to include error bars on the plotted data points. State one possible effect this omission could have on interpreting the data. (1 mark)
Mark scheme:
(a)
1 mark for each correct feature:
• Axes must include the quantity name (e.g. Current, Potential difference).
• Axes must include the unit in brackets (e.g. (A), (V)).
(Alternative acceptable answers: clear and even scales, or appropriately labelled variables, up to 2 marks total.)
(b)
1 mark for stating that consistent use of prefixes and units prevents confusion or misinterpretation of numerical data.
1 mark for explaining that it ensures dimensional consistency, allowing accurate comparison and calculation between quantities.
(c)
1 mark for recognising that the reliability or uncertainty of the measurements cannot be visually assessed, making it harder to judge the accuracy of the line of best fit.
FAQ
The prefixes up to tera cover the scale of quantities typically used in A-Level physics experiments and theory.
Beyond tera, values such as peta (10¹⁵) or exa (10¹⁸) are rarely encountered in school-level physics. These are mainly used in astrophysics, computing, or high-energy particle physics, which go beyond the OCR syllabus. Restricting to pico–tera ensures students master realistic quantities relevant to laboratory and exam contexts.
Significant figures indicate the precision of a value — how many digits are meaningful, starting from the first non-zero digit.
Decimal places count how many digits appear after the decimal point, regardless of value size.
For example:
0.00450 has 3 significant figures but 5 decimal places.
Physics data conventionally prioritises significant figures, as they better represent measurement precision and uncertainty.
Placing units in brackets (e.g. Voltage (V)) in headings avoids repetition and clutter.
This format ensures that every value in the column or axis is clearly associated with that unit without redundancy.
It improves readability.
It avoids the risk of missing or inconsistent units within data entries.
It aligns with formal scientific publication conventions, ensuring professional presentation in practical write-ups.
Prefixes smaller than milli are used when the measured quantity is extremely small — common in modern electronics or atomic-scale physics.
Examples include:
Micro (10⁻⁶): current in microamperes (μA) for sensitive circuits.
Nano (10⁻⁹): wavelength of light in nanometres (nm).
Pico (10⁻¹²): capacitance in picofarads (pF).
Using these prefixes helps keep numbers readable and avoids long strings of zeros, maintaining scientific clarity.
Error bars show the range within which the true value is expected to lie, based on experimental uncertainty.
Each data point’s bar extends above and below (for y-values) or side to side (for x-values) by one uncertainty value.
Longer error bars mean greater uncertainty.
Shorter bars indicate higher precision.
They allow comparison between datasets and help determine whether differences are significant or within the range of measurement error.
