
OCR Specification focus:
‘Plan and carry out force–extension experiments for springs, rubber bands or polythene strips with care.’
Investigating force–extension characteristics reveals how materials deform under applied forces. Understanding these experimental relationships is fundamental for exploring elasticity, energy storage, and material behaviour in physics and engineering.
Understanding Force–Extension Relationships
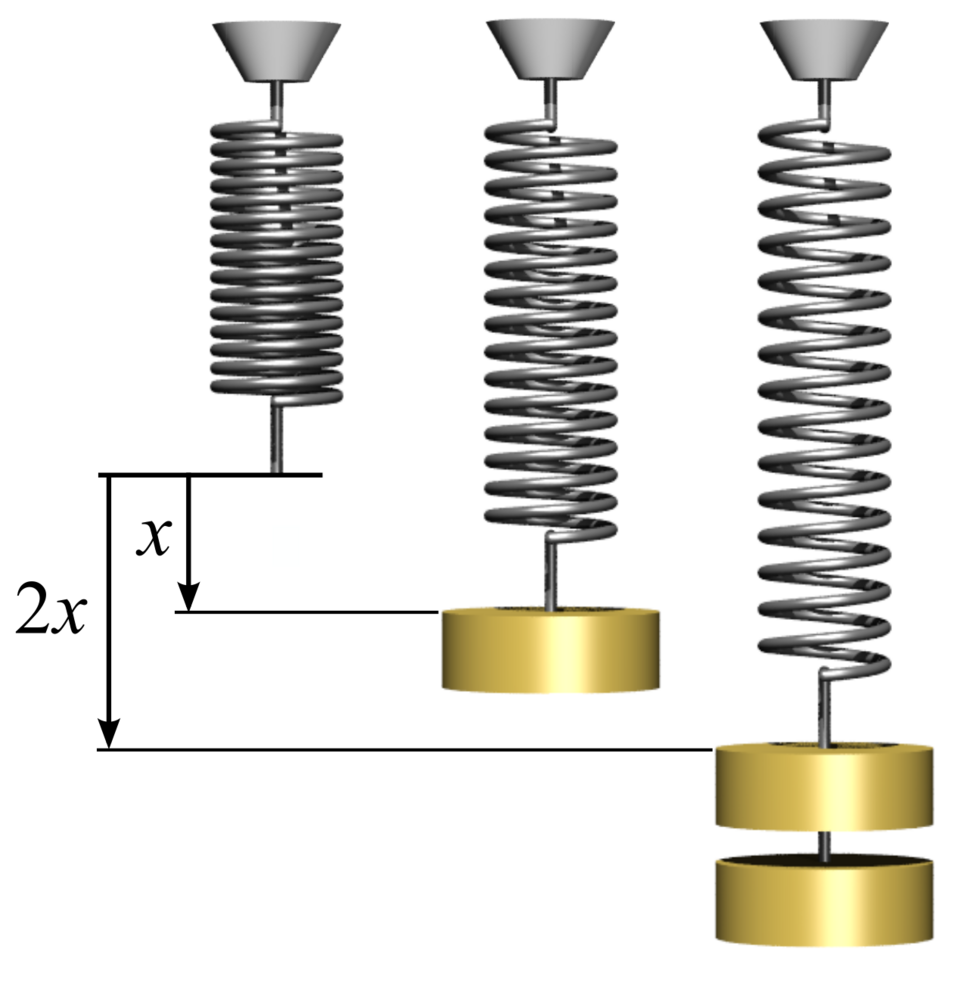
A force–extension investigation examines how an applied force (F) affects the extension (x) of an elastic material such as a spring, rubber band, or polythene strip. By measuring how the extension changes with increasing load, students can determine key material properties, including stiffness and elasticity. This experimental process reinforces concepts such as Hooke’s law, elastic limit, and energy storage within deformed materials.
Apparatus and Materials
A well-designed force–extension experiment uses carefully selected apparatus to ensure accurate and reliable data. Essential components include:
Clamp stand and boss head — to secure the spring or sample vertically.
Metre ruler or vernier scale — to measure extension precisely.
Set of known masses — to apply measurable and increasing forces.
Pointer or marker — attached to the lower end of the material to indicate position on the scale.
Safety equipment — eye protection is essential when using springs or elastic materials that may recoil.
For softer materials such as rubber bands or polythene strips, additional precautions are needed to prevent sudden snapping or permanent deformation.
Planning the Experiment
Key Aims
The investigation seeks to:
Establish the relationship between force and extension.
Identify the elastic region, limit of proportionality, and any plastic behaviour.
Compare materials (e.g., spring vs. rubber band) in terms of energy storage and hysteresis.
Controlled Variables
To ensure validity, maintain:
Temperature — as elasticity changes with temperature, particularly for polymers.
Initial length and diameter — consistent across trials for fair comparison.
Rate of loading — apply and remove masses gradually to avoid dynamic effects.
Conducting the Experiment
Step-by-Step Procedure
Setup the apparatus securely on a stable surface.
Measure the material’s unstretched length with no load applied.
Add masses incrementally, recording the new length each time.
Calculate extension using
extension = stretched length − original length.Repeat measurements for accuracy, removing each mass slowly to observe elastic recovery.
Plot a graph of force (y-axis) against extension (x-axis) to analyse the relationship.
Plot force (N) against extension (m), expecting a straight line through the origin within the limit of proportionality.
Force–extension graph for a helical spring showing a straight-line region consistent with Hooke’s law. The gradient corresponds to the force constant k while the onset of curvature marks departure from proportionality. This diagram focuses on the proportional region required at A Level; plastic effects and energy analysis are not shown. Source.
Safety Considerations
Use light masses initially to avoid sudden overstretching.
Do not exceed the elastic limit.
Stand to the side when releasing stretched materials.
Data Analysis and Graphical Interpretation
Force–Extension Graph
The force–extension graph reveals critical information about the material’s mechanical response:
The straight-line region represents the range where Hooke’s law applies — force is proportional to extension.
The limit of proportionality marks the point beyond which proportionality breaks down.
Beyond this point, the material may still behave elastically, but not linearly.
The elastic limit defines the boundary between elastic and plastic deformation — once passed, the material will not return to its original shape.
EQUATION
—-----------------------------------------------------------------
Hooke’s Law (Force–Extension Relationship) = F = kx
F = Force applied to the spring (newton, N)
k = Force constant or stiffness of the spring (newton per metre, N m⁻¹)
x = Extension from natural length (metre, m)
—-----------------------------------------------------------------
The gradient of the linear region gives the force constant (k) of the spring or material. A steeper gradient corresponds to a stiffer material.
Between two points on the graph, the area under the curve represents the work done in stretching — equivalent to the elastic potential energy stored in the material.
Comparing Different Materials
Springs
Exhibit highly reproducible and linear force–extension characteristics.
Obey Hooke’s law over a wide range of forces.
Useful for calibration in measuring devices like newton metres.
Rubber Bands
Display a non-linear relationship even at low extensions.
Show hysteresis — the loading and unloading curves differ because some energy is lost as heat during each stretch–relax cycle.
Demonstrate complex polymeric behaviour, ideal for discussions on entropy elasticity.
For a rubber band, repeat the measurements while loading and then unloading to reveal a hysteresis loop (different paths for the same force).
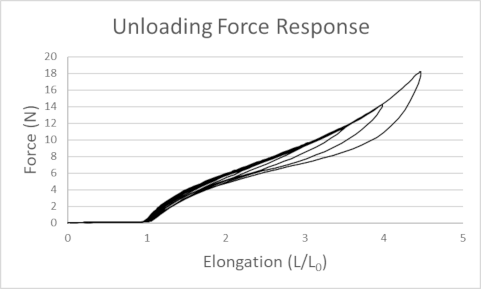

Experimental force–extension curves for a rubber band showing loading and unloading paths that do not coincide, demonstrating viscoelastic hysteresis. The enclosed area represents energy dissipated per cycle. Extra detail: the source also discusses bungee-cord modelling; only the loading–unloading loop is needed here. Source.
Polythene Strips
Exhibit plastic deformation at relatively small extensions.
Once stretched beyond a certain point, they do not return to their original length.
Illustrate permanent structural rearrangement within the polymer chains.
Improving Reliability and Accuracy
To produce valid data:
Use a fiducial marker for consistent length readings.
Take readings at eye level to avoid parallax error.
Repeat each measurement and calculate the mean extension.
Plot error bars to visualise uncertainty.
Zero the scale before adding masses to eliminate systematic error.
When analysing data, students should look for anomalies, check whether the line of best fit passes through the origin, and discuss any deviations from expected behaviour.
Evaluating Experimental Findings
The quality of a force–extension experiment depends on both precision of measurement and interpretation of material response. For example:
A linear graph through the origin indicates pure elastic behaviour following Hooke’s law.
A curved relationship suggests non-linear elasticity, often in polymers.
A difference between loading and unloading curves signifies energy dissipation due to internal friction or molecular rearrangement.
Such evaluation allows comparison between theoretical predictions and practical observations, reinforcing understanding of mechanical properties and their real-world implications.
Practical Applications
Force–extension investigations underpin many practical designs:
Vehicle suspension systems rely on springs that operate within their elastic limits.
Elastic bands and seals exploit the reversible deformation of rubber.
Plastic films demonstrate the importance of understanding yield and plastic flow.
Through careful experimentation, students connect measured quantities to material behaviour, gaining insight into both macroscopic mechanics and molecular structure — the foundation of material science and engineering analysis.
Practice Questions
Question 1 (2 marks)
A student investigates the force–extension relationship for a steel spring by hanging masses from it and recording the extension.
(a) Describe what is meant by the limit of proportionality in this context.
Mark scheme
1 mark: Recognises that it is the point up to which force and extension are directly proportional.
1 mark: States that beyond this point, the spring no longer obeys Hooke’s law (the graph ceases to be a straight line).
Question 2 (5 marks)
A student conducts a force–extension experiment using a rubber band. The graph produced during loading and unloading does not follow the same path.
(a) Explain what this difference between loading and unloading curves shows about the behaviour of the rubber band. (2 marks)
(b) Describe two ways the student could improve the reliability of their results in this investigation. (2 marks)
(c) State one safety precaution that should be taken when carrying out the experiment. (1 mark)
Mark scheme
(a)
1 mark: Recognises that the difference shows hysteresis or energy loss.
1 mark: Explains that energy is dissipated as heat within the material during each stretch–relax cycle.
(b)
1 mark: Suggests repeating the measurements and taking averages to reduce random errors.
1 mark: Mentions using a fiducial marker or taking readings at eye level to avoid parallax error (any valid method of improving reliability).
(c)
1 mark: Identifies an appropriate safety precaution, such as wearing eye protection or standing to the side in case the rubber band snaps.
FAQ
Adding or removing masses too quickly can cause oscillations or jerks that introduce errors in the measured extension. Rapid loading may also temporarily heat the material, especially polymers like rubber, slightly altering their elastic behaviour.
Gradual loading allows the system to reach equilibrium before readings are taken, ensuring the measured extension reflects static deformation rather than transient vibrations or momentum effects.
A temporary set occurs when a material appears stretched after removing the load but slowly returns to its original length due to internal molecular rearrangement.
A permanent set happens when the material is stretched beyond its elastic limit, causing irreversible deformation.
Springs usually show temporary set within the elastic limit.
Polymers, such as polythene, often exhibit permanent set even at moderate extensions.
Temperature affects the internal energy and bonding strength of materials.
For metals, higher temperatures reduce stiffness (lower force constant k).
For polymers, temperature significantly changes elasticity due to molecular motion and alignment.
Maintaining constant temperature ensures that any changes in extension are due only to applied force, not thermal expansion or softening effects.
Several methods improve precision:
Use a fiducial marker attached to the material for clear reference points.
Read extensions at eye level to avoid parallax error.
Use a vernier scale or travelling microscope for fine measurements.
Repeat readings for each load and calculate a mean extension.
Minimising uncertainty ensures the force–extension graph accurately reflects the material’s true mechanical response.
Hysteresis occurs because internal friction between polymer chains converts some mechanical work into heat.
During loading, molecular chains stretch and align; during unloading, they recoil irregularly, dissipating energy rather than storing it all elastically.
The area between the loading and unloading curves on the graph represents energy lost as heat — this is why rubber bands feel warm after repeated stretching.
