
OCR Specification focus:
‘Interpret stress–strain graphs for ductile, brittle and polymeric materials; compare elastic and plastic behaviour.’
Stress–strain graphs reveal how materials deform and ultimately fail under tension, providing insight into their elastic and plastic behaviours and allowing comparison between ductile, brittle, and polymeric substances.
Understanding Stress–Strain Graphs
A stress–strain graph is a plot showing how a material responds to applied force per unit area (stress) against the resulting fractional change in length (strain). This relationship helps characterise a material’s mechanical properties and resistance to deformation.
Stress: The force per unit cross-sectional area within a material when a load is applied.
Strain: The ratio of the extension (or compression) of a material to its original length, representing its deformation relative to size.
Stress–strain graphs are typically obtained by applying increasing tensile forces to a specimen and measuring its extension. Each region of the graph corresponds to a distinct type of mechanical behaviour, from initial elasticity to permanent deformation and eventual fracture.
Key Features of a Stress–Strain Graph
The Proportional (Linear) Region
At the start of the graph, stress is directly proportional to strain, following Hooke’s law.
This region is represented by a straight line through the origin, where the gradient corresponds to the Young modulus (E)—a measure of stiffness.
Within this region, the material will return to its original shape when the load is removed.
EQUATION
—-----------------------------------------------------------------
Young Modulus (E) = Stress / Strain
Stress = Force ÷ Cross-sectional area (Pa)
Strain = Extension ÷ Original length (dimensionless)
—-----------------------------------------------------------------
This proportional behaviour continues until the limit of proportionality, where the material begins to deviate slightly from linearity though it may still be elastic.
The Elastic Limit
Beyond the limit of proportionality lies the elastic limit, the maximum stress a material can withstand and still return completely to its original shape.
If stress is removed before reaching this point, the material recovers fully.
Beyond it, plastic deformation begins — the change in shape becomes permanent.
Yield Point and Plastic Region
The yield point marks the onset of significant plastic deformation with little or no increase in stress.
In this region, atomic bonds are stretched and begin to slip past each other.
Once yielding begins, small increases in load can cause large increases in strain.
This plastic behaviour is vital for materials used in structural applications, as it allows them to deform without sudden failure.
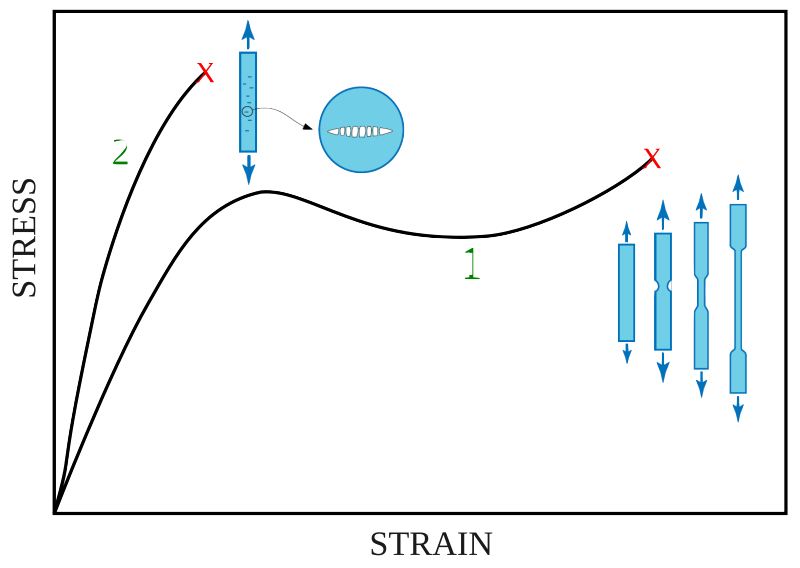
Ultimate Tensile Stress (UTS)
The UTS represents the maximum stress the material can endure before it begins to neck (thin) or weaken.
At this point, micro-cracks or voids form within the structure, concentrating stress in localised regions.
Although the applied force might still increase slightly, the effective load-bearing area decreases, leading eventually to fracture.
Fracture Point
After the UTS, the material continues to stretch locally until fracture occurs.
The final point on the graph indicates failure, where the specimen breaks apart.
Types of Material Behaviour
Ductile Materials
Ductile materials (e.g. copper, mild steel) show a long, extended plastic region on their stress–strain graphs.
They undergo significant deformation before breaking.
Their graphs feature a well-defined yield point, large strain at fracture, and a gradual slope reduction after the UTS.
These materials can be drawn into wires or reshaped without fracture, owing to their ability to plastically deform.
Ductility: The ability of a material to undergo significant plastic deformation before fracture, typically measured by percentage elongation.
In ductile materials, energy absorption before fracture is high, making them ideal for load-bearing structures that must resist sudden impact or overload.
Brittle Materials
Brittle materials (e.g. glass, ceramics, cast iron) behave differently.
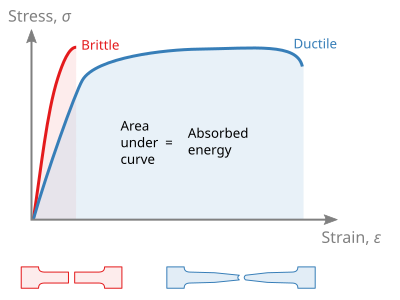
Side-by-side stress–strain curves compare ductile and brittle behaviour. The ductile curve shows yield, plastic flow and large strain before fracture, whereas the brittle curve remains almost linear and fails abruptly. Labels are clear and the layout is uncluttered. Source.
Their stress–strain graphs are almost linear until fracture.
They exhibit little or no plastic deformation and break suddenly once the elastic limit is exceeded.
The area under their graph is relatively small, indicating low energy absorption before failure.
Brittleness: The tendency of a material to fracture with little or no plastic deformation when subjected to stress.
Because they cannot yield plastically, brittle materials fail abruptly, making them unsuitable for applications where flexibility or impact resistance is needed.
Polymeric Materials
Polymeric materials (e.g. rubber, polythene) display complex, non-linear stress–strain behaviour.
A labelled polymer stress–strain diagram distinguishing ductile failure (necking and large strain) from brittle failure (limited strain). It highlights the variation in stiffness at low strain and the extended plastic region in some polymers. The diagram is simple, high-resolution SVG with minimal text. Source.
Their graphs show an initial region of low stiffness where molecular chains uncoil, followed by a steep increase in stress as the chains align and resist further stretching.
On unloading, they exhibit hysteresis, meaning the loading and unloading curves do not coincide. This difference represents energy loss, typically as heat, during deformation.
Hysteresis: The phenomenon where the loading and unloading paths on a stress–strain graph differ, indicating energy dissipation during a deformation cycle.
Polymers often exhibit elastic behaviour that is non-Hookean, meaning stress and strain are not proportional. Many return to their original shape after stretching but with noticeable time-dependent effects (viscoelasticity).
Comparing Elastic and Plastic Behaviour
Elastic behaviour occurs when a material returns fully to its original dimensions once stress is removed. Plastic behaviour occurs when permanent deformation remains. The transition between these depends on the material’s internal atomic or molecular structure.
In metals, delocalised electrons and mobile dislocations allow atoms to slide past each other, leading to ductility.
In ceramics, strong directional ionic or covalent bonds resist movement, resulting in brittleness.
In polymers, long-chain molecules can stretch, rotate, and realign, producing flexibility and hysteresis.
Understanding these differences allows engineers and physicists to select materials appropriate to specific mechanical requirements — balancing stiffness, strength, and resilience for optimal performance across varied applications.
Practice Questions
Question 1 (2 marks)
State one key difference between the stress–strain graphs of ductile and brittle materials, and explain how this relates to their mechanical behaviour.
Mark Scheme
1 mark for identifying a key difference (e.g. ductile materials show a long plastic region, brittle materials fracture after the elastic limit).
1 mark for linking the graph shape to behaviour (e.g. ductile materials can deform plastically before breaking, whereas brittle materials fracture suddenly with little warning).
Question 2 (5 marks)
The diagram below shows a simplified stress–strain graph for a metal wire under tension.
Label and describe the following regions or points:
(a) the proportional (linear) region
(b) the elastic limit
(c) the yield point
(d) the ultimate tensile stress (UTS)
(e) the fracture point.
Explain what happens to the material at each stage of the graph.
(a) 1 mark – Proportional region correctly identified as the initial straight line where stress is directly proportional to strain (Hooke’s law applies).
(b) 1 mark – Elastic limit identified as the maximum point at which the material returns to its original shape when the stress is removed.
(c) 1 mark – Yield point identified as the start of plastic deformation where strain increases rapidly with little increase in stress.
(d) 1 mark – Ultimate tensile stress (UTS) identified as the highest stress the material can withstand before necking or weakening begins.
(e) 1 mark – Fracture point described as the point at which the material breaks apart due to failure of internal structure.
FAQ
The shape depends on the material’s atomic or molecular bonding and its microstructure.
Metals have non-directional metallic bonds that allow dislocations to move easily, producing long plastic regions.
Ceramics have strong ionic or covalent bonds that resist atomic movement, creating steep, brittle graphs.
Polymers consist of tangled molecular chains; uncoiling, alignment, and sliding of these chains lead to non-linear, extended stress–strain behaviour.
Processing methods, temperature, and strain rate can also modify the graph’s shape by affecting how easily atoms or molecules can move.
Necking happens when a localised region in a material begins to thin under high stress after the ultimate tensile stress is reached.
As the cross-sectional area decreases:
Stress becomes concentrated in the necked region.
Strain accelerates there, drawing more deformation to that spot.
Eventually, microscopic voids coalesce, causing fracture.
Necking is typical in ductile materials because they can redistribute stress and deform plastically before breaking.
Increasing temperature generally makes materials more ductile and less strong.
Metals soften as atomic vibrations increase, allowing dislocations to move more freely.
Polymers may transition from brittle to rubbery behaviour near or above their glass transition temperature.
Ceramics, however, may not gain ductility and often weaken rapidly due to thermal stress or cracking.
At low temperatures, most materials become more brittle, reducing strain before fracture.
The total area under a stress–strain graph corresponds to the energy per unit volume absorbed by the material up to that point.
In the elastic region, this is elastic strain energy, which is recoverable when the stress is removed.
In the plastic region, it includes energy dissipated as heat and energy stored in permanent atomic rearrangements.
For design, a larger area before fracture indicates higher toughness — the ability to absorb energy without breaking.
Polymers have long molecular chains that can slowly reorient, slide, and untangle under stress.
This produces viscoelastic behaviour, where deformation depends on both stress magnitude and duration:
Under constant stress, strain increases over time (creep).
Under constant strain, stress relaxes as chains realign (stress relaxation).
As a result, loading and unloading paths differ, forming hysteresis loops and revealing delayed recovery of shape.
