
AP Syllabus focus:
‘In disturbed ecosystems, succession changes total biomass, species richness, and net productivity over time.’
Ecological succession is a predictable pattern of community change after disturbance.
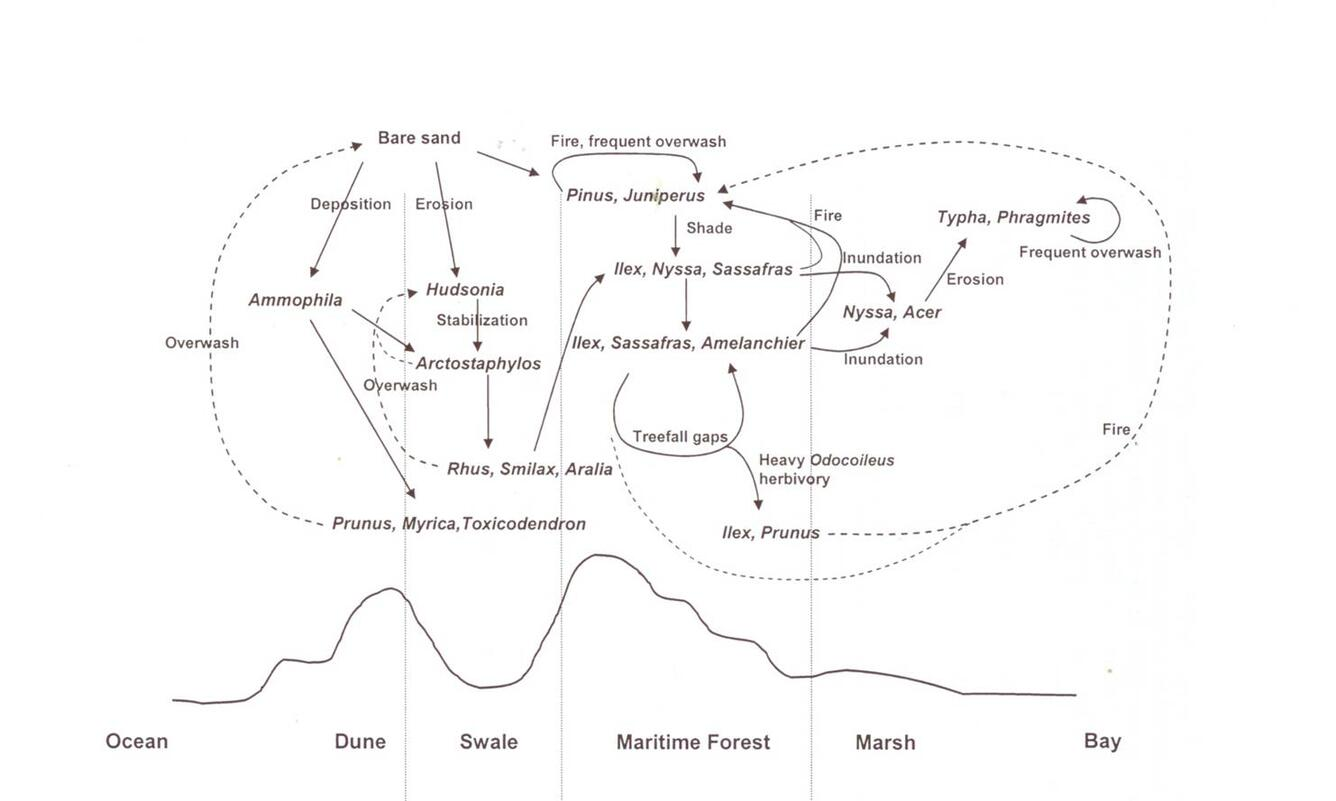
This diagram shows a sequence of plant community stages following disturbance, progressing from early pioneer vegetation to shrub/young forest stages and then to a mature forest community. It helps you visualize how changes in dominant life forms over time drive major shifts in ecosystem structure (canopy height, layering, and habitat complexity). Source
As species replace one another, ecosystem structure and function shift in measurable ways, especially total biomass, species richness, and net productivity.
How succession shifts ecosystem properties
Succession changes what kinds of organisms dominate, how energy flows, and how matter is stored. These changes are often described across “early” to “late” successional stages, without assuming a single fixed endpoint.
Total biomass over time
Total biomass generally increases through succession as larger, longer-lived organisms become more abundant and organic matter accumulates in living tissue and soils.
Biomass: the total mass of living organic material in a given area at a given time (often expressed as dry mass per unit area).
Key patterns in disturbed ecosystems:
Early stages: low biomass because vegetation is sparse and organisms are small/short-lived.
Middle stages: biomass rises quickly as plant cover closes and carbon storage increases.
Later stages: biomass may continue to increase but often slows as growth balances mortality and decomposition; more biomass is stored in woody tissue and soil organic matter.
Species richness over time
Species richness often follows a “hump-shaped” pattern: it tends to rise after disturbance as habitats and niches diversify, then may level off or decline slightly if a few strong competitors dominate.
Species richness: the number of different species present in an ecosystem or defined area.
Why richness changes with succession:
Early stages: fewer species can tolerate exposed conditions, limited shelter, and variable moisture/temperature.
Intermediate stages: more microhabitats form (shade, leaf litter, layered vegetation), increasing niche availability and allowing coexistence.
Later stages: increased shading and competition can exclude some species, reducing richness even while stability and structural complexity increase.
Net productivity over time
Net productivity typically increases early in succession as fast-growing organisms capture resources efficiently, then declines later as respiration costs rise and growth slows.
Net primary productivity (NPP): the rate at which producers store energy as new biomass after subtracting energy used for respiration, per unit area per unit time.
A common way to express net productivity is:
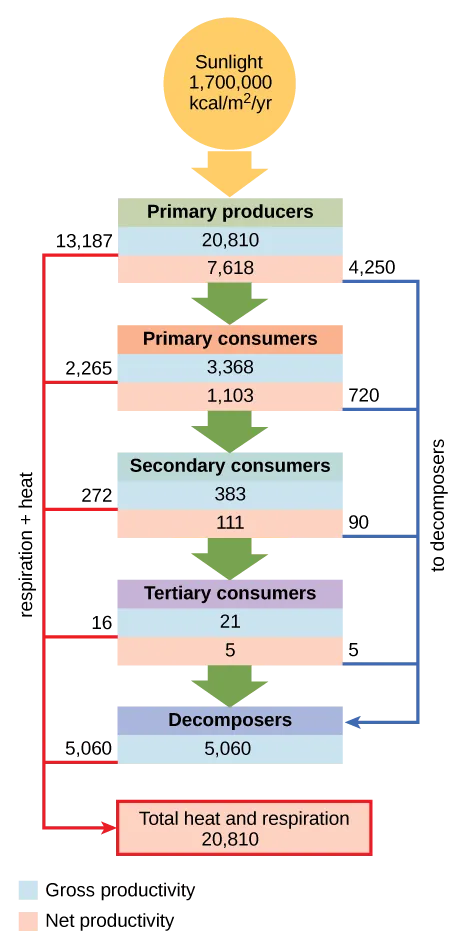
This conceptual energy-flow model traces how energy captured by producers is partitioned into gross primary productivity, losses to respiration, and the remaining net productivity that can be transferred to consumers and decomposers. It concretely visualizes the bookkeeping behind by showing respiration/heat losses at each step of the ecosystem energy pathway. Source
= net primary productivity (e.g., )
= gross primary productivity, total photosynthetic production (e.g., )
= respiration by producers (e.g., )
Interpreting the trend:
Early succession: NPP is often high because GPP rises rapidly with increasing plant cover, while R is relatively low due to smaller total biomass.
Later succession: NPP often decreases as total biomass (and thus R) increases, nutrients become more tightly cycled, and growth rates slow; ecosystems may have high GPP but also high respiration.
Linking the three changes in disturbed ecosystems
Because these properties are connected, a disturbance can reset them together:
Lower biomass usually means fewer producers and less habitat structure, which can limit species richness.
As biomass and structural complexity build, more niches support higher richness.
As biomass accumulates, respiration demands increase, helping explain why net productivity can peak earlier than total biomass.
Practice Questions
Describe how total biomass typically changes during succession in a disturbed ecosystem. (2 marks)
Biomass increases over time as vegetation and organic matter accumulate (1).
Rate of increase slows/levels in later stages as growth balances mortality/decomposition (1).
Explain how species richness and net primary productivity (NPP) can change over time during succession after a disturbance. (5 marks)
Species richness often increases from early to intermediate stages due to increasing habitat/niche diversity (1).
Richness may level off or slightly decline later due to competition/shading excluding some species (1).
NPP tends to rise early as producer cover and resource capture increase (1).
NPP often peaks then declines later as respiration increases with greater biomass and growth slows (1).
Correct linkage between the two trends (e.g., structural complexity supports richness while rising respiration helps reduce NPP) (1).
FAQ
Large, severe disturbances can delay richness increases by limiting colonists. Smaller, patchy disturbances can boost richness by creating a mosaic of successional stages.
Later systems can have high photosynthesis but even higher producer respiration because maintaining large amounts of living tissue is energetically costly.
Common approaches include allometric equations from tree diameter/height, harvest methods for herbaceous plants, and repeated plot inventories to track standing biomass.
If key nutrients become locked in biomass/soil organic matter or are scarce, GPP may plateau; NPP can drop earlier because plants invest more in maintenance than growth.
Yes—where frequent mild disturbance or environmental stress prevents biomass accumulation but maintains many small niches, allowing many species to coexist at low standing biomass.
