
AP Syllabus focus: ‘The PPC illustrates opportunity cost and trade-offs, showing what must be given up to produce more of another good.’
Producing more of one desirable good usually means producing less of another because resources are limited. The production possibilities curve (PPC) is the core model AP Macroeconomics uses to visualise these trade-offs.
Opportunity Cost and Trade-offs on the PPC
What the PPC is showing (only what you need here)
A PPC compares two categories of output an economy could produce in a given time period when it uses its resources in alternative ways.
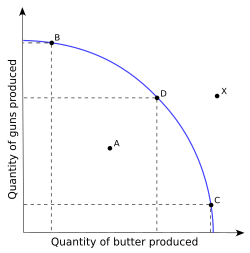
A production possibilities frontier (PPF) diagram illustrating the boundary between attainable and unattainable combinations of two goods. Points on the curve represent productive efficiency, while points inside the curve indicate underutilized resources (inefficiency) and points outside are infeasible given current resources and technology. This visual reinforces that the PPC summarizes the economy’s constraint set before any reallocation choices are made. Source
Any point on the PPC represents a choice about how to allocate scarce resources between those two outputs.
Opportunity cost: the “give up” behind every movement
When you move along a PPC toward more of one good, you must reallocate resources away from the other good. The output you sacrifice is the opportunity cost of the increase.
Opportunity cost: The value of the next best alternative that is given up when a choice is made.
In the PPC context, the next best alternative is typically “more of the other good.” The key AP phrasing is that opportunity cost is what must be given up to produce more of another good.
Trade-offs: why “more” always implies “less”
A trade-off is the unavoidable result of scarcity: choosing more of one output requires choosing less of something else. On a PPC, trade-offs appear as:
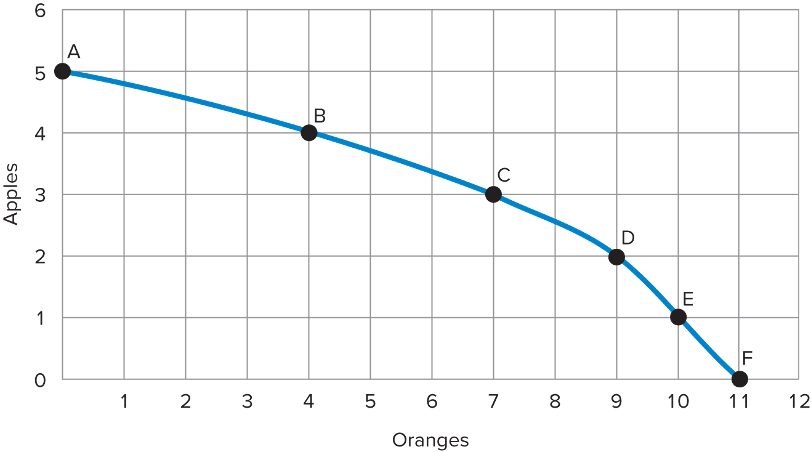
A production possibilities curve (PPC) showing feasible, efficient production combinations of two goods (apples and oranges). The labeled points (A–F) make it easy to illustrate that moving toward more of one good requires giving up some of the other, which is the opportunity cost of that move. Because the curve is bowed outward, the amount sacrificed per additional unit tends to rise as the economy specializes. Source
A movement toward one axis (more of that output)
A simultaneous movement away from the other axis (less of the other output)
Trade-offs are not about money prices; they are about real resource constraints (labor, capital, land, entrepreneurship) that can’t be fully devoted to both outputs at once.
Reading opportunity cost from the slope
Along a PPC, opportunity cost can be interpreted using the curve’s slope: how much of one good must be sacrificed to gain an extra unit of the other good.
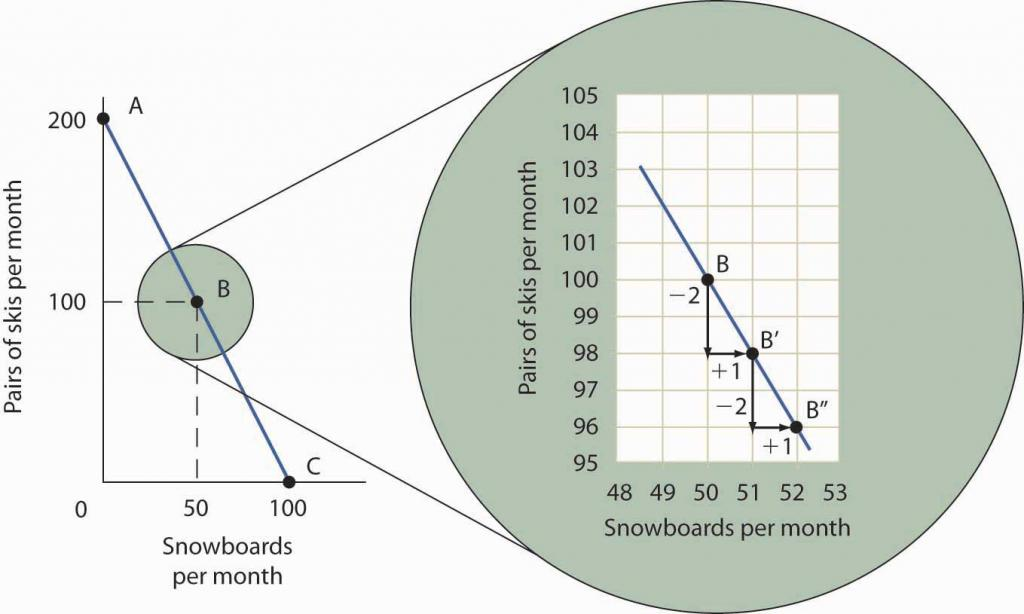
A PPC slope diagram that zooms in on a small movement along the frontier to show how a marginal increase in one good requires a marginal decrease in the other. The vertical change and horizontal change correspond to and , so the slope magnitude is interpreted as marginal opportunity cost. This helps link the geometry of the curve to the idea of “what must be given up” when reallocating scarce resources. Source
= Change in output of good (units)
= Change in output of good (units)
This equation captures the idea that the opportunity cost of getting more is the amount of you give up. The absolute value is used because opportunity cost is reported as a positive “cost,” even though is typically negative when is positive.
What counts as a trade-off movement (and what doesn’t)
For AP purposes, opportunity cost and trade-offs are tied to movements along the PPC that reflect changing production choices.
Moving along the PPC: shows reallocation of existing resources, creating trade-offs and opportunity costs.
Staying at the same point: no new trade-off is made (no change in production mix).
To keep your reasoning tight, always connect your claim to the model: “Because resources are scarce and must be reallocated, producing more of one good requires giving up some of the other.”
Common language that earns credit
When explaining a PPC trade-off, use precise cause-and-effect:
“To produce more of good , resources must be shifted from producing good .”
“The opportunity cost of more is the amount of forgone.”
“The PPC illustrates scarcity by showing that not all combinations are attainable simultaneously.”
What the “cost” means in macroeconomic thinking
In macroeconomics, opportunity cost is central because it frames policy and societal choices as real trade-offs, such as:
Allocating productive capacity across different categories of output
Accepting less of one outcome to achieve more of another
The PPC is valuable because it forces you to state the cost of a choice clearly: every gain has an alternative you must sacrifice.
Practice Questions
(2 marks) Using the PPC, define opportunity cost and explain what happens to the other good when production of one good increases.
1 mark: Defines opportunity cost as the next best alternative forgone / what must be given up.
1 mark: States that increasing production of one good requires giving up some of the other good (movement along the PPC implies a trade-off).
(5 marks) An economy produces only consumer goods () and capital goods (). Explain how the PPC illustrates (i) trade-offs and (ii) opportunity cost when the economy chooses to produce more .
1 mark: Identifies that the PPC shows alternative combinations of and achievable with scarce resources.
2 marks: Explains trade-off: moving towards more requires reallocating resources away from , so falls.
2 marks: Explains opportunity cost: the amount of forgone is the opportunity cost of producing extra ; may reference slope as for full credit.
FAQ
Because the PPC is a real-output model. It compares alternative quantities given fixed resources, so the cost is best expressed as foregone production of the other good, not prices.
Yes. The opportunity cost of more $X$ is forgone $Y$, but the opportunity cost of more $Y$ is forgone $X$. Always state which good is increasing.
A trade-off is the general idea that you can’t have more of both. Opportunity cost is the specific amount of the other good you give up for a chosen increase.
The slope summarises the rate of sacrifice between the two goods. Even without calculation, a steeper slope implies more of the other good must be given up per extra unit.
Use “forgo” or “sacrifice” and name the alternative explicitly, e.g., “Producing more $K$ means forgoing some $C$ due to resource reallocation.”
