
AP Syllabus focus: ‘The shape of the PPC reflects whether opportunity costs are constant, increasing, or decreasing depending on resource allocation.’
Opportunity cost on a production possibilities curve (PPC) is not always the same per unit. Understanding constant, increasing, and decreasing opportunity costs helps you interpret PPC shape and explain why trade-offs change as production shifts.
Opportunity Cost Types and PPC Shape
Core idea: marginal trade-offs
Opportunity cost on the PPC is usually discussed at the margin: how much of one good must be given up to gain one more unit of the other good. This is why the shape of the PPC matters.
Marginal opportunity cost: the amount of one good that must be sacrificed to produce one additional unit of another good.
Marginal opportunity cost is read from the PPC as you move along the curve, not from a single endpoint comparison.
= change in output of good given up (units of )
= change in output of good gained (units of )
In PPC terms, this ratio corresponds to the slope (in absolute value) between two nearby points on the curve.
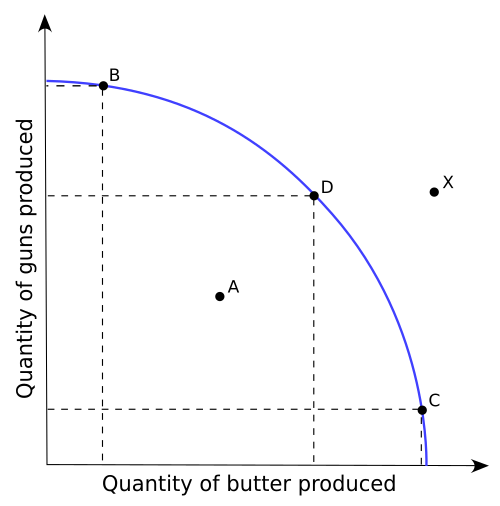
A production possibilities frontier (PPC/PPF) showing feasible combinations of two goods, with labeled points on the curve (efficient), inside the curve (inefficient), and outside the curve (unattainable). The curvature illustrates how the slope of the PPC captures the marginal trade-off (marginal opportunity cost) as you move along the frontier. Source
Constant Opportunity Cost (Linear PPC)
What it means
When the PPC is a straight line, the trade-off between the two goods is unchanged across different output combinations.
Constant opportunity cost: the opportunity cost per additional unit stays the same as resources shift between two goods.
Why it happens (conceptually)
Constant opportunity cost is most consistent with:
Resources that are perfectly adaptable between the two goods (equally productive in either use)
No increasing difficulty in shifting resources as output changes
How it appears on a PPC
A linear PPC indicates constant marginal trade-offs.
Each step toward more of one good costs the same amount of the other good.
Increasing Opportunity Cost (Bowed-Out PPC)
What it means
Most PPCs are bowed outward, showing that producing more of one good becomes increasingly costly in terms of the other good.
Increasing opportunity cost: each additional unit of one good requires giving up more and more of the other good.
Why it happens (resource specificity)
Increasing opportunity cost arises because resources are often specialised:
Some labour, capital, or land is better suited to producing one good than the other.
As production shifts, the economy reallocates resources that are initially well-suited, then increasingly uses resources that are less suited, reducing efficiency in the expanding sector.
How it appears on a PPC
The PPC is concave to the origin (bowed outward).
Moving rightward (more of good ) makes the PPC steeper in absolute value: the marginal opportunity cost rises.
Decreasing Opportunity Cost (Bowed-In PPC)
What it means
In rarer cases, the opportunity cost of producing additional units can fall as output expands.
Decreasing opportunity cost: each additional unit of one good requires giving up less and less of the other good.
When it could occur (limited PPC interpretation)
A bowed-in PPC can reflect situations where reallocating resources makes the expanding sector relatively more efficient over the relevant range, such as:
Resources becoming more compatible with the expanding good as the mix changes
Reallocation that initially removes poorly matched resources, leaving a better match for subsequent expansion
How it appears on a PPC
The PPC is convex to the origin (bowed inward).
The slope in absolute value becomes smaller as output of one good increases: the marginal opportunity cost falls.
Reading “Types of Opportunity Costs” from the PPC
What you should be able to infer quickly
Straight-line PPC → constant marginal opportunity cost
Bowed-out PPC → increasing marginal opportunity cost (the standard case)
Bowed-in PPC → decreasing marginal opportunity cost (uncommon)
Common interpretation language
When describing opportunity cost types, use precise, PPC-based phrasing:
“As the economy produces more of good , it gives up increasing amounts of good per unit of .”
“The PPC’s changing slope indicates that marginal trade-offs change with resource allocation.”
Practice Questions
(2 marks) Explain how a straight-line PPC illustrates constant opportunity cost.
Identifies that the PPC is linear/straight (1)
Explains that the trade-off (sacrifice of the other good per extra unit) is the same at all points / constant marginal opportunity cost (1)
(6 marks) A country’s PPC is bowed outward between consumer goods and capital goods. Using the concept of opportunity cost, explain what this shape implies about resource allocation as production shifts towards consumer goods.
States that a bowed-out PPC indicates increasing opportunity cost (1)
Explains that marginal opportunity cost rises as more consumer goods are produced (1)
Links rising cost to resources being specialised/not equally suited to both goods (1)
Explains that early reallocations use more suitable resources, later reallocations use less suitable resources (1)
Connects this to giving up increasingly larger quantities of capital goods per additional consumer good (1)
Uses clear PPC language such as changing slope/steepening in absolute value to support the explanation (1)
FAQ
Because many factors of production are specialised.
Labour skills, machinery, and land are rarely equally productive in all uses, so shifting production typically reallocates increasingly less suitable resources, raising marginal trade-offs.
Yes. It would imply marginal opportunity cost is constant over the linear segment and then becomes increasing where the curve bows outward.
This can reflect ranges where resources are similarly adaptable at first, then become more specialised.
Average opportunity cost compares endpoints (total $Y$ given up divided by total $X$ gained).
Marginal opportunity cost focuses on the trade-off for the next unit (or small change) and aligns with the PPC’s slope between nearby points.
No. Scarcity still exists; decreasing opportunity cost only describes how the trade-off changes as output shifts.
It suggests that, over some range, reallocating resources makes additional units relatively less costly in terms of the other good.
Compute the opportunity cost between successive steps: $|\Delta Y/\Delta X|$.
If that value rises as you move in one direction along the combinations, marginal opportunity cost is increasing, consistent with a bowed-out PPC.
