
AP Syllabus focus: ‘The production possibilities curve (PPC) is a model that shows trade-offs when allocating scarce resources between different goods.’
The production possibilities curve (PPC) is a core macroeconomic model for visualising how scarcity constrains an economy. It highlights the trade-offs society faces when deciding how to allocate limited resources across alternative outputs.
The PPC: what it shows
The PPC represents the maximum combinations of two categories of goods (or outputs) that can be produced in a given period, using existing resources and technology.
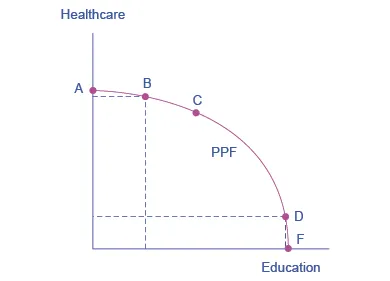
Production possibilities frontier (PPF) graph showing a trade-off between two goods on the axes (healthcare vs. education). Points on the frontier represent the maximum attainable combinations given scarce resources, while moving along the curve illustrates opportunity cost (more of one good requires giving up some of the other). Source
Production possibilities curve (PPC). A graph showing the maximum attainable combinations of two goods an economy can produce when resources are fully and efficiently employed, given current technology.
The “two-good” simplification
Economists use two goods (often consumer goods vs capital goods, or military vs civilian goods) because it makes economy-wide trade-offs easy to see without changing the underlying logic.
Assumptions behind the model (what must be held constant)
A PPC is built under specific simplifying assumptions. In AP Macroeconomics, you should treat these as the “rules of the graph”:
Fixed resources (quantity and quality of labour, capital, land, entrepreneurship are constant)
Fixed technology (no innovation during the period shown)
A fixed time period (e.g., “this year”)
Efficient use of resources (points on the curve are feasible only when resources are fully utilised)
Output is limited to two goods (a modelling choice, not reality)
These assumptions ensure the PPC isolates one idea: trade-offs when allocating scarce resources between different goods.
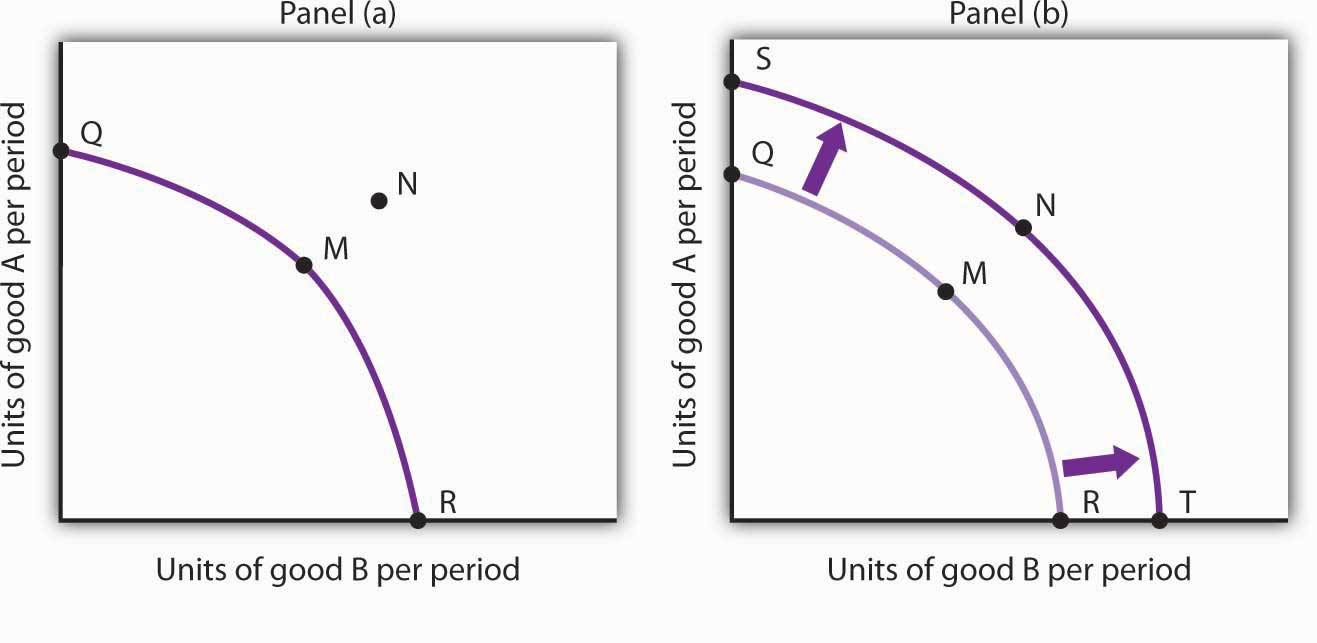
Two-panel PPF diagram showing economic growth as an outward shift of the production possibilities curve. The outward shift indicates higher productive capacity, making combinations that were previously unattainable (outside the old curve) feasible under the new curve. Source
Reading the PPC: trade-offs and attainable combinations
Points on the curve
Any point on the PPC is productively efficient: producing more of one good requires producing less of the other, because scarce resources must be reallocated.
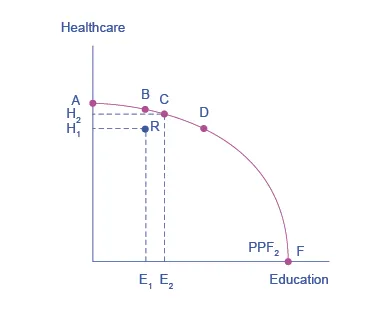
PPF diagram distinguishing productively efficient points on the frontier from an inefficient point inside the curve. The figure helps students interpret what it means to be on the boundary (full and efficient use of resources) versus inside the boundary (underutilization or misallocation). Source
Moving along the curve illustrates a trade-off
The curve is a frontier: it marks the boundary of what is achievable given constraints
What “trade-off” means on a PPC
A trade-off is the need to give up some quantity of one good to gain more of another because resources (workers, machines, raw materials) are limited and have alternative uses.
Why the PPC is a macro model (not just a micro graph)
At the economy level, the PPC helps frame big policy and social choices, such as:
producing more consumer goods now versus more capital goods that support future production
reallocating resources toward national priorities (healthcare, infrastructure, defence)
The PPC does not tell society which point is “best”; it shows what is possible under scarcity and what must be sacrificed to change the output mix.
Interpreting the axes and labels
To use the PPC correctly, always specify:
what each axis measures (units or categories of output)
the time period (per month, per year)
that the curve represents maximum output combinations, not average or desired outcomes
Clear labels matter because the PPC is fundamentally about allocation: how scarce inputs are directed across competing uses.
Practice Questions
Q1 (2 marks): Define a production possibilities curve (PPC) and state what it demonstrates about scarcity.
1 mark: Correct definition: maximum attainable combinations of two goods given fixed resources/technology and full efficient employment.
1 mark: States it demonstrates trade-offs/choices due to scarcity (limited resources).
Q2 (5 marks): Explain how the PPC model is constructed and how a movement along the PPC illustrates trade-offs in allocating scarce resources between two goods.
1 mark: States PPC assumes a fixed time period and two goods.
1 mark: States resources and technology are held constant.
1 mark: Explains points on the curve represent maximum feasible combinations with full and efficient employment.
1 mark: Explains moving along the curve requires reallocating resources from one good to the other.
1 mark: Links reallocation to trade-offs caused by scarcity (more of one implies less of the other).
FAQ
It maps directly onto economy-wide choices between present consumption and building productive capacity for the future.
It also aligns with policy discussions (investment incentives, long-run growth priorities) while keeping the model simple.
Yes. “Goods” on a PPC can mean any outputs, including services (e.g., healthcare visits vs education hours).
What matters is that both outputs use scarce resources and can be compared over a defined period.
A PPC is based on production limits from resources/technology at the economy level.
A budget constraint is based on income and prices for a consumer or firm; it reflects purchasing power rather than productive capacity.
Production possibilities depend on how long resources can be used and outputs can be made.
Without a time frame, “maximum output” is ambiguous (per day versus per year implies very different feasible quantities).
Measurement issues and changing conditions can blur the frontier, such as:
variable worker effort and hours
imperfect data on capacity utilisation
short-run disruptions (weather, supply bottlenecks)
