
AP Syllabus focus: ‘The circular flow diagram shows the flow of income and expenditure between households and firms.’
The circular flow model is a foundational visual tool for connecting production, income, and spending. By tracking how households and firms interact through markets, it clarifies why total output, total income, and total expenditure move together.
Core Idea of the Circular Flow
What the model represents
Circular flow model: A diagram that shows how households and firms exchange resources and goods and services, and how money payments (income and spending) move between them.
In AP Macroeconomics, the circular flow diagram is used to highlight a simple but powerful relationship: households supply inputs and demand products, while firms demand inputs and supply products. This interaction creates two linked loops that occur simultaneously.
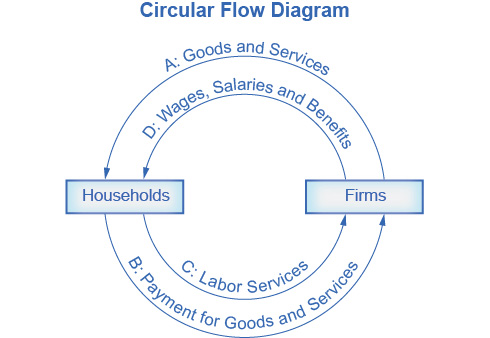
A two-sector circular flow diagram showing households and firms connected by two simultaneous loops. One loop represents real flows (labor services and goods & services) and the other represents money flows (wages/salaries and consumer payments), making it easy to track directionality and avoid reversing roles. Source
Two kinds of “flows”
Real (physical) flows
Factors of production (labour, land, capital, entrepreneurship) move from households to firms.
Final goods and services move from firms to households.
Money flows
Income (wages, rent, interest, profit) is paid by firms to households for factor services.
Expenditure (consumer spending) is paid by households to firms for goods and services.
A key implication is that money spent by households becomes revenue for firms, which becomes income for households again—supporting ongoing production.
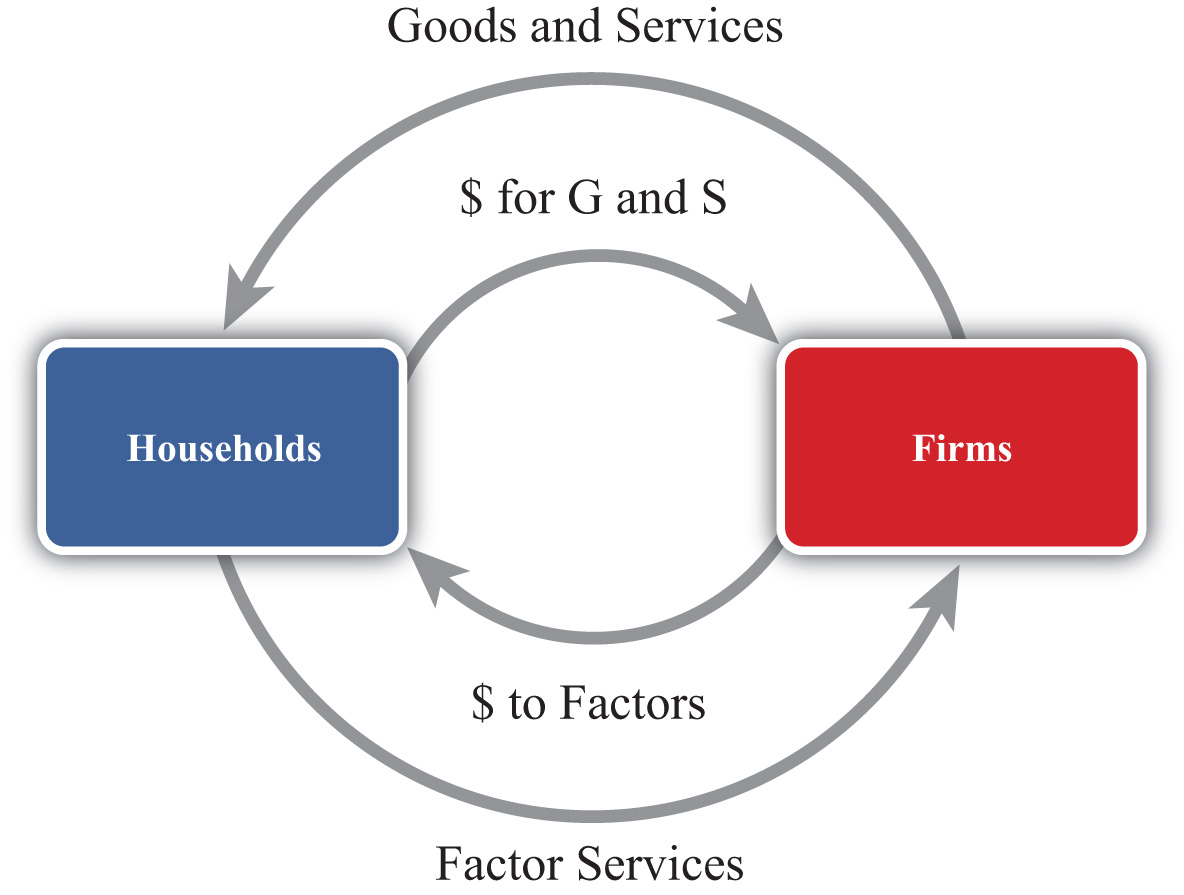
A simplified circular-flow diagram that highlights the core macro logic: households purchase goods and services from firms, and firms use that revenue to pay for factor services. This visual helps connect expenditure and income as two perspectives on the same continuous set of transactions. Source
The Two-Sector Circular Flow: Households and Firms
Households
Households play two roles:
Resource owners: they provide labour and other inputs to firms.
Consumers: they purchase goods and services produced by firms.
Income received by households depends on the quantity and prices of resources they supply (for example, wage rates and hours worked).
Firms
Firms also play two roles:
Producers: they transform inputs into goods and services.
Buyers of resources: they hire labour and acquire other factors of production.
Firms’ ability to pay income to households depends on the revenue they earn from household spending in the product market.
The Markets That Connect Households and Firms
Factor (resource) market
Factor market: The market where households supply factor services (especially labour) and firms demand them, determining factor prices such as wages.
The factor market explains why production generates income: firms must pay households to obtain inputs. These payments are the income side of the circular flow.
A common AP pitfall is reversing roles: in the factor market, households are sellers and firms are buyers.
Product (goods and services) market
Product market: The market where firms supply goods and services and households demand them, determining prices and firms’ sales revenue.
In the product market, the direction flips: firms are sellers and households are buyers. Household spending in this market is the expenditure side of the circular flow.
Why the Circular Flow Matters for Macro Measurement
Linking income and expenditure
The syllabus emphasis—“the flow of income and expenditure between households and firms”—captures a central macro insight: the economy’s total spending and total income are connected because they are two ways of viewing the same ongoing transactions.
In the simplified two-sector model:
Household expenditure on goods and services becomes firm revenue.
Firm revenue funds payments that become household income.
Interpreting “final output” through the model
Because households buy final goods and services from firms in the product market, the circular flow diagram reinforces the idea that production is ultimately measured by what is purchased for final use, not by intermediate transactions within the supply chain.
Common Diagram Reading Skills (What to Look For)
Identify the two main agents: households and firms.
Distinguish markets:
Factor market: resources and income payments.
Product market: goods/services and consumer spending.
Trace direction carefully:
Real flows go one way; money flows go the opposite way.
Use the diagram to explain cause-and-effect:
More hiring → more household income → more spending → more firm revenue (and the reverse if spending falls).
Practice Questions
Q1 (2 marks): Using the circular flow model, state what households provide to firms and what firms provide to households.
1 mark: Households provide factors of production/resources (e.g., labour) to firms.
1 mark: Firms provide goods and services to households.
Q2 (6 marks): Explain how the circular flow diagram shows the relationship between household income and household expenditure in a two-sector economy.
1 mark: Identifies that households receive income from firms for supplying factor services (wages/rent/interest/profit).
1 mark: Explains that households use income to make expenditure on goods and services in the product market.
1 mark: Explains that household spending becomes firm revenue.
1 mark: Links firm revenue to firms’ ability to pay factor incomes (closing the loop).
1 mark: Correctly distinguishes factor market versus product market roles (households sell factors; firms sell products).
1 mark: Mentions the presence of real flows and money flows moving in opposite directions.
FAQ
Because the model separates real flows (resources, goods, services) from money flows (payments). Drawing them in opposite directions helps you see that every real transaction has a matching payment.
In the strict two-sector version, saving is usually assumed away to keep the loop simple. More realistic versions add a financial sector so saving can become lending that supports spending.
Mixing up buyers and sellers. In the factor market, households sell factor services and firms buy them, even though households are buyers in the product market.
No. Income includes all payments to factors of production, such as wages, rent, interest, and profit, depending on which factor is being supplied.
Because it shows the same activity viewed as (1) production of goods and services, (2) payments generating income, and (3) spending on output—different perspectives on interconnected transactions.
