
AP Syllabus focus: ‘GDP can be viewed as total income earned and total spending in the economy.’
GDP is often introduced as “output,” but in national income accounting it is equally valid to view GDP as total spending and as total income. This page explains why those measures match in a circular-flow economy.
Core idea: one transaction, two equal records
When a final good or service is produced and sold, the economy records the same event in two ways:
Expenditure: a buyer spends money on the final good or service.
Income: a seller receives revenue, which becomes income to workers and owners after paying production costs.
Because every purchase is someone else’s receipt, total spending in the economy equals total income in the economy (within the same accounting period).
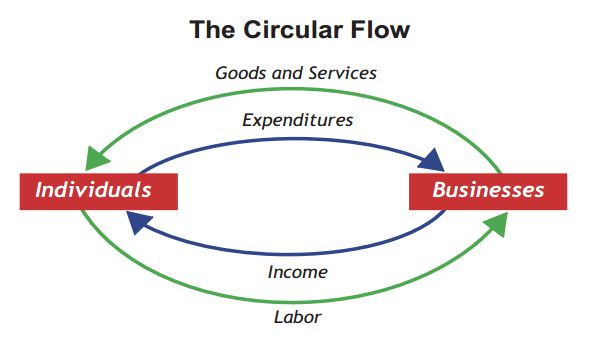
A circular-flow diagram showing how dollars move between households and firms as spending (expenditure) and as income (factor payments). It visually reinforces the accounting point that the same transaction is recorded as both someone’s expenditure and someone else’s income, so the economy-wide totals match. Source
GDP as total expenditure (spending view)
The expenditure view adds up all spending on final goods and services produced domestically during the year. The key point for this subtopic is not the categories of spending, but the logic:
A final good or service is purchased.
The purchase price reflects the market value of that final output.
Summing those purchases yields the economy’s total spending on final output.
Why “final” matters for the spending view
Counting only final goods prevents double counting, because the value of intermediate goods is embedded in the final sale price. This helps spending-based GDP reflect the value of final production once.
GDP as total income (earnings view)
The income view adds up all income generated by producing final goods and services within the country. Production generates revenue for firms, which is then distributed as income to resource owners (workers and owners of capital, land, and entrepreneurship).
The flow from revenue to income
A simplified sequence:
Households supply resources (labour, capital, etc.) to firms.
Firms pay factor payments (income to resource owners).
Firms sell output; the spending by buyers becomes firm revenue.
That revenue supports the factor payments and any remaining income to owners.
Even though individual markets are complex, the accounting principle is consistent: expenditure on final output becomes income to someone.
The accounting identity linking the two views
= Market value of final goods and services produced domestically in a given period (dollars per year)
= Sum of spending on domestically produced final goods and services (dollars per year)
= Sum of incomes earned from producing domestically produced final goods and services (dollars per year)
This identity holds because national accounts are built from transactions that inherently have both a spending side and an income side.
Connecting the identity to the circular flow
In the circular flow model, money moves in opposite direction to real resources:
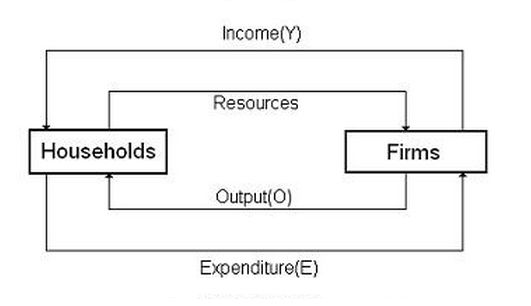
A two-sector circular-flow model labeling the real flow (resources and output) and the monetary flow (income and expenditure) between households and firms. The diagram emphasizes that real resources go from households to firms while money flows in the opposite direction, aligning with the circular-flow explanation of . Source
Households supply resources to firms; firms pay households income.
Households (and other buyers) purchase final goods and services; this is expenditure that becomes firm revenue.
The same dollars that leave buyers as spending reappear as income to households and business owners.
What the identity does (and does not) claim
It claims equality of economy-wide totals, not that each household’s spending equals its own income.
It does not imply everyone spends all income; saving is still part of the flow of funds. The key is that GDP counts spending on final output, and the production of that output generates income of equal value.
Practical measurement note: why published totals can differ slightly
Statistical discrepancy: The measured difference between GDP estimated from the expenditure side and GDP estimated from the income side due to data limitations and timing/reporting differences.
In practice, agencies use many data sources and must estimate some items, so the two independently measured totals may not match perfectly. The discrepancy reflects measurement, not a failure of the underlying identity.
Common pitfalls students should avoid
Confusing production with sales: GDP is tied to production of final goods and services; the accounting system is designed so the spending and income recorded correspond to that production.
Mixing domestic with national concepts: GDP counts production within a country’s borders; income earned abroad by residents is not part of GDP.
Including intermediate transactions: Intermediate purchases are excluded from spending-based GDP to avoid double counting; their value shows up in the final price and, therefore, in incomes generated by final production.
Treating transfers as GDP: Payments like benefits are not payments for currently produced goods/services, so they are not part of GDP even though they affect household income and spending capacity.
Practice Questions
(3 marks) Explain why total expenditure in an economy equals total income when measuring GDP.
1 mark: States that one person’s spending is another person’s receipt/revenue.
1 mark: Links revenue from sales of final goods/services to incomes earned in production (e.g., factor payments/profits).
1 mark: Concludes that economy-wide totals of expenditure and income are equal (GDP identity).
(6 marks) Using the circular flow, explain how a purchase of a final good creates equal amounts of expenditure and income in GDP, and state one reason why published expenditure-based and income-based GDP estimates may differ.
1 mark: Identifies spending on a final good as part of total expenditure (GDP).
1 mark: Explains that the purchase becomes firm revenue/receipt.
1 mark: Explains that revenue is paid out as income to households/resource owners (wages, rent, interest, profit acceptable as examples).
1 mark: Explicitly links the circular flow (households supply resources; firms pay income; households buy goods/services).
1 mark: States the identity (words or formula).
1 mark: Gives a valid reason for differences in published estimates (e.g., statistical discrepancy from measurement error, timing, incomplete reporting).
FAQ
Statistical agencies build the two measures from different data sources (surveys, tax records, business reports), each with gaps and timing issues.
Small differences arise from:
sampling and reporting error
revisions as better data arrive
imputed/estimated items and underreporting
The gap is recorded as a statistical discrepancy.
If production occurs but goods are not sold, the accounting system treats them as additions to business inventories.
This ensures recorded expenditure matches production-based income generated during that period, even when final sales lag behind production.
Not exactly. GDP-as-income is broader than take-home pay. It is income generated in production, including amounts that may not reach households immediately (e.g., retained earnings, some taxes on production).
Personal income also includes transfers, which GDP excludes.
They are conceptually the same total but use different measurement routes:
expenditure totals purchases of final output
income totals earnings generated by producing it
output totals value added
Using multiple approaches provides cross-checks and improves reliability after revisions.
GDP is a gross measure, meaning it includes the portion of production that covers wear and tear on capital (depreciation).
Net measures subtract depreciation (often discussed as net domestic product), but GDP itself remains gross by definition.
