
AP Syllabus focus: ‘The inflation rate is the percentage change in a price index such as the CPI.’
Inflation is calculated from movements in a published price index over time.
This page explains what “percentage change” means, how to apply the formula consistently, and how to interpret the result in the units AP Macroeconomics expects.
What it means to “calculate inflation”
To calculate inflation, you compare the price level in two time periods using a price index (for example, the Consumer Price Index (CPI)). A price index reports prices in index-number form (relative to a chosen base period), so inflation is found by converting the change in the index into a percentage.
Inflation rate (core definition)
Inflation rate: The percentage change in a price index from one period to the next.
Inflation calculations always require:
A starting period (earlier index value)
An ending period (later index value)
A clear time interval (monthly, quarterly, yearly)
The inflation-rate formula
The AP exam expects you to compute inflation as a percent change, not as a simple difference in index points.
= Price index level in the current period (index points)
= Price index level in the previous period (index points)
= Converts the ratio into a percentage (percent)
Because the denominator is last period’s index, this measures how much prices rose or fell relative to the earlier period’s price level.
Units and reporting conventions
The result is stated in percent (%).
The time unit is “per period” (for example, percent per year if you use annual CPI data).
Rounding should be reasonable and consistent (the exam typically accepts sensible rounding).
Choosing periods correctly
Inflation is always tied to the interval you select. Common comparisons include:
Year-over-year (YoY): same month/quarter compared across two years (reduces seasonal effects when using monthly data).
Period-to-period: one month/quarter to the next (more responsive, but can be volatile).
Multi-year changes: valid, but then you are calculating the percent change over a longer window (not automatically an annual rate).
Matching the data frequency
Use index values that match the time period stated in the question:
If asked for inflation from 2024 to 2025, use the index for 2024 and 2025.
If asked for inflation from Q1 to Q2, use the index for Q1 and Q2.
Interpreting the calculated number
A calculated inflation rate:
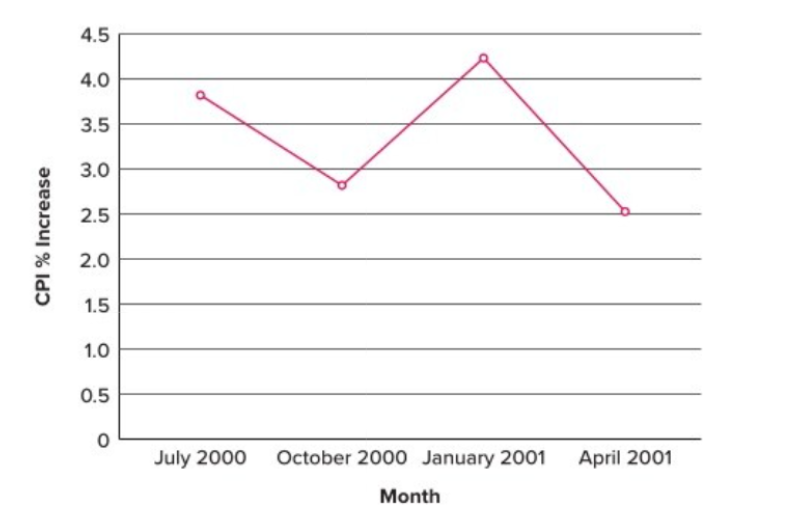
Line graph of CPI inflation plotted as a percent change over time. This visual reinforces that inflation is a rate of change (measured in percent) rather than the CPI’s index-point level. Source
Above 0% indicates the overall price level (as measured by the index) increased over the interval.
Equal to 0% indicates no change in the index over the interval.
Below 0% indicates the index fell over the interval (overall prices decreased according to the index).
Be careful to distinguish:
Index points: the raw difference,
Percent change: the inflation rate computed with the formula (this is what the syllabus targets)
Common mistakes to avoid
Using the wrong denominator: inflation uses the earlier period in the denominator, not the later period.
Forgetting to multiply by 100: leaving the answer as a decimal rather than a percent.
Mixing index series: only compare values from the same index (e.g., CPI-U with CPI-U, not with a different CPI variant).
Confusing “points” with “percent”: an index rising by 5 points is not necessarily 5% inflation.
Not stating the time frame: “2%” is incomplete without “per year,” “per month,” etc., when context is unclear.
Practice Questions
(2 marks) The CPI is 200 in 2024 and 210 in 2025. Calculate the inflation rate from 2024 to 2025.
Uses percent change method: (1)
Correct inflation rate of (1)
(6 marks) A price index is 150 in Year 1, 156 in Year 2, and 165 in Year 3. (a) Calculate the inflation rate from Year 1 to Year 2. (2 marks) (b) Calculate the inflation rate from Year 2 to Year 3. (2 marks) (c) Identify which year-to-year interval had the higher inflation rate and justify using your results. (2 marks)
(a) Correct setup: (1); correct result (1)
(b) Correct setup: (1); correct result (1)
(c) Correct identification (Year 2 to Year 3) (1); justification by comparing computed percentages (1)
FAQ
If you have a single-month inflation rate $m$ (in decimal form), a common annualisation is $(1+m)^{12}-1$.
A simpler approximation is $12m$, but it is less accurate when $m$ is not very small.
Rebasing changes the index’s reference level (e.g., setting a new base to 100), but percent changes between two periods remain the same if both values come from the rebased series.
Do not mix pre-rebase and post-rebase values without using the consistent rebased series.
Index points do not account for the starting level of prices.
Percent change standardises the movement relative to the earlier period, making inflation comparable across time and across different index base values.
It represents the percent change in the average price level over the year compared with the previous year’s average.
This can differ from “December-to-December” inflation, which compares specific months.
Seasonally adjusted indices remove predictable seasonal patterns before calculating changes.
Using seasonally adjusted data can make month-to-month inflation more interpretable, but you should not mix adjusted and unadjusted series in the same calculation.
