
AP Syllabus focus: ‘Price indices allow comparison of purchasing power and prices across different time periods.’
Price indices convert many individual prices into a single number, making it possible to track how the overall price level changes across years. This helps economists compare purchasing power over time using consistent units.
Core idea: comparing price levels across time
A price index turns prices in each year into an index number relative to one chosen year.
Interpreting index numbers correctly is the key to using them over time.
Price index: a measure that compares the average level of prices in one period to the average level of prices in a base year, typically scaled so the base year equals 100.
An index answers the question: “How expensive is the typical set of purchases in this year compared with the base year?”
Base year and index scaling
The base year is the reference point; its index value is set to 100
If an index is 120, the overall price level is 20% higher than in the base year
If an index is 90, the overall price level is 10% lower than in the base year
Because the index is scaled, you can compare any two years by using their index values (not just each year versus the base year).
Using indices to compare purchasing power
A major use of price indices over time is converting nominal dollar figures (measured in current dollars) into real figures (adjusted for changes in the price level). This allows meaningful comparisons of wages, income, spending, or output across different years.
= inflation-adjusted amount in base-year dollars
= amount measured in current dollars
= index number for the year of the nominal value (base year = 100)
Deflating with an index isolates changes in purchasing power from changes in the price level, letting you determine whether “more dollars” actually buys more.
Comparing years directly (without converting to dollars)
Sometimes you only need a relative comparison of prices:
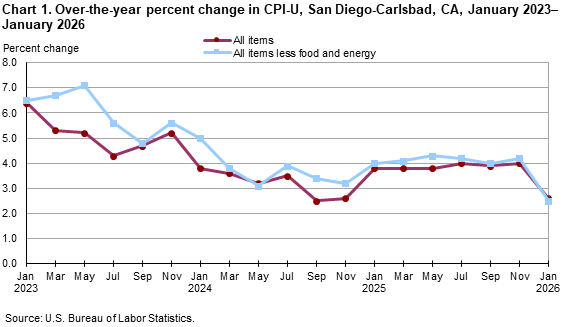
This Bureau of Labor Statistics line chart plots the over-the-year (12‑month) percent change in CPI-U, which is a common way to summarize how quickly a price index is rising. It illustrates that even when an index is always measured relative to a base period, economists often analyze the rate of change to describe inflation dynamics over time. Source
If the index rises from one year to another, the overall price level increased
The ratio of two index values shows how much higher prices are in one year than another
This is useful for comparing the cost level faced by households (for example, the same salary may “go further” in the lower-index year)
Practical applications over time
Cost-of-living comparisons
Price indices are widely used to compare cost of living across time:
Evaluating whether households are better off requires comparing income or wages to the index
A rising nominal wage does not guarantee rising well-being if the index rises faster
Indexation (tying payments to an index)
Governments and firms often use indexation to keep payments aligned with changes in the price level.
Indexation: adjusting a payment (such as wages, pensions, or tax brackets) based on a price index to maintain purchasing power over time.
Common uses include:
Cost-of-living adjustments (COLAs) for wages or benefits
Updating long-term contracts so real obligations do not drift due to price level changes
Adjusting policy thresholds (for example, eligibility cutoffs) so they stay comparable in real terms
Interpreting what an index can and cannot tell you
When using price indices over time, keep the interpretation tight:
A price index tracks the overall price level for the items it represents; it does not describe every individual price
The index is most informative when you use it consistently: same index series, clear base year, and the appropriate time comparisons
Different indices may move differently because they represent different sets of goods and services, so comparisons should specify which index is being used
Practice Questions
(2 marks) Explain how a price index allows a comparison of purchasing power between two years.
1 mark: States that the index measures the price level in each year relative to a base year.
1 mark: Explains that comparing index values (or deflating nominal values) shows which year’s money buys more goods and services.
(5 marks) A worker’s nominal wage rises over time. Describe how you would use a price index to determine whether the worker’s real purchasing power has increased. Include one reason why the base year matters.
1 mark: States that nominal wages must be adjusted using a price index to obtain real wages/purchasing power.
1 mark: Uses an appropriate method, e.g. (or equivalent deflation description).
1 mark: Compares real values across the two years to judge purchasing power (increase/decrease/unchanged).
1 mark: Explains base year sets the unit (base-year pounds/dollars) and index scaling (base year = 100).
1 mark: Links base year choice to consistent comparison over time (real values are expressed in the same base-year prices).
FAQ
They periodically rebase to keep the reference year modern and improve readability.
Rebasing changes the scale (which year = 100) but not the underlying inflation pattern.
No. Properly rebased series preserve relative movements.
Problems arise mainly when mixing series with different base years without converting them.
Index level compares a year to the base year.
An index ratio compares two non-base years directly by dividing their index values.
They track different baskets/scopes.
Household-focused indices emphasise consumer purchases
Broader indices may include investment goods or government services
Indexation often uses past published index data.
This lag can temporarily over- or under-compensate for price-level changes until the next adjustment.
