
AP Syllabus focus: ‘The CPI measures the cost of a fixed basket of goods and services over time.’
The Consumer Price Index (CPI) is the most commonly cited measure of inflation faced by households. Understanding how it is built and interpreted helps you connect changes in the overall price level to purchasing power and policy discussions.
Core idea: a fixed basket over time
Consumer Price Index (CPI): An index number that measures the average change over time in the prices paid by consumers for a fixed basket of goods and services.
The CPI is designed to track how expensive it becomes to maintain a consistent pattern of consumer purchases. It focuses on consumer goods and services (not all goods produced in the economy).
The “basket” and why it is fixed
Market basket: A selected bundle of goods and services meant to represent typical household purchases, held constant so price changes can be compared across time.
A fixed basket means the quantities (and composition) are treated as constant for measurement purposes over the comparison window. This lets the CPI isolate price changes rather than changes in what people buy.
CPI as an index number
Index number: A statistic that expresses values relative to a base period, typically scaled so the base equals 100.
Because the CPI is an index, its level is meaningful mainly in comparison:
A higher CPI than last year indicates prices are higher for the basket.
The base period anchors the index at 100, so later values show how much the basket’s cost has changed relative to that base.
How the CPI is constructed (conceptually)
Government statisticians (in the U.S., the Bureau of Labor Statistics) build the CPI using large-scale price collection and a representative basket. At a high level, the process involves:
Selecting a reference population (typical consumers) and identifying what they buy
Defining categories (for example, housing, transportation, medical care) and assigning expenditure weights
Collecting prices for specific items over time from sampled outlets and locations
Aggregating price changes into a single index using the fixed basket and weights
Expenditure weights (importance of “typical” spending)
Items that take a larger share of household budgets (often housing) carry more weight in the index.
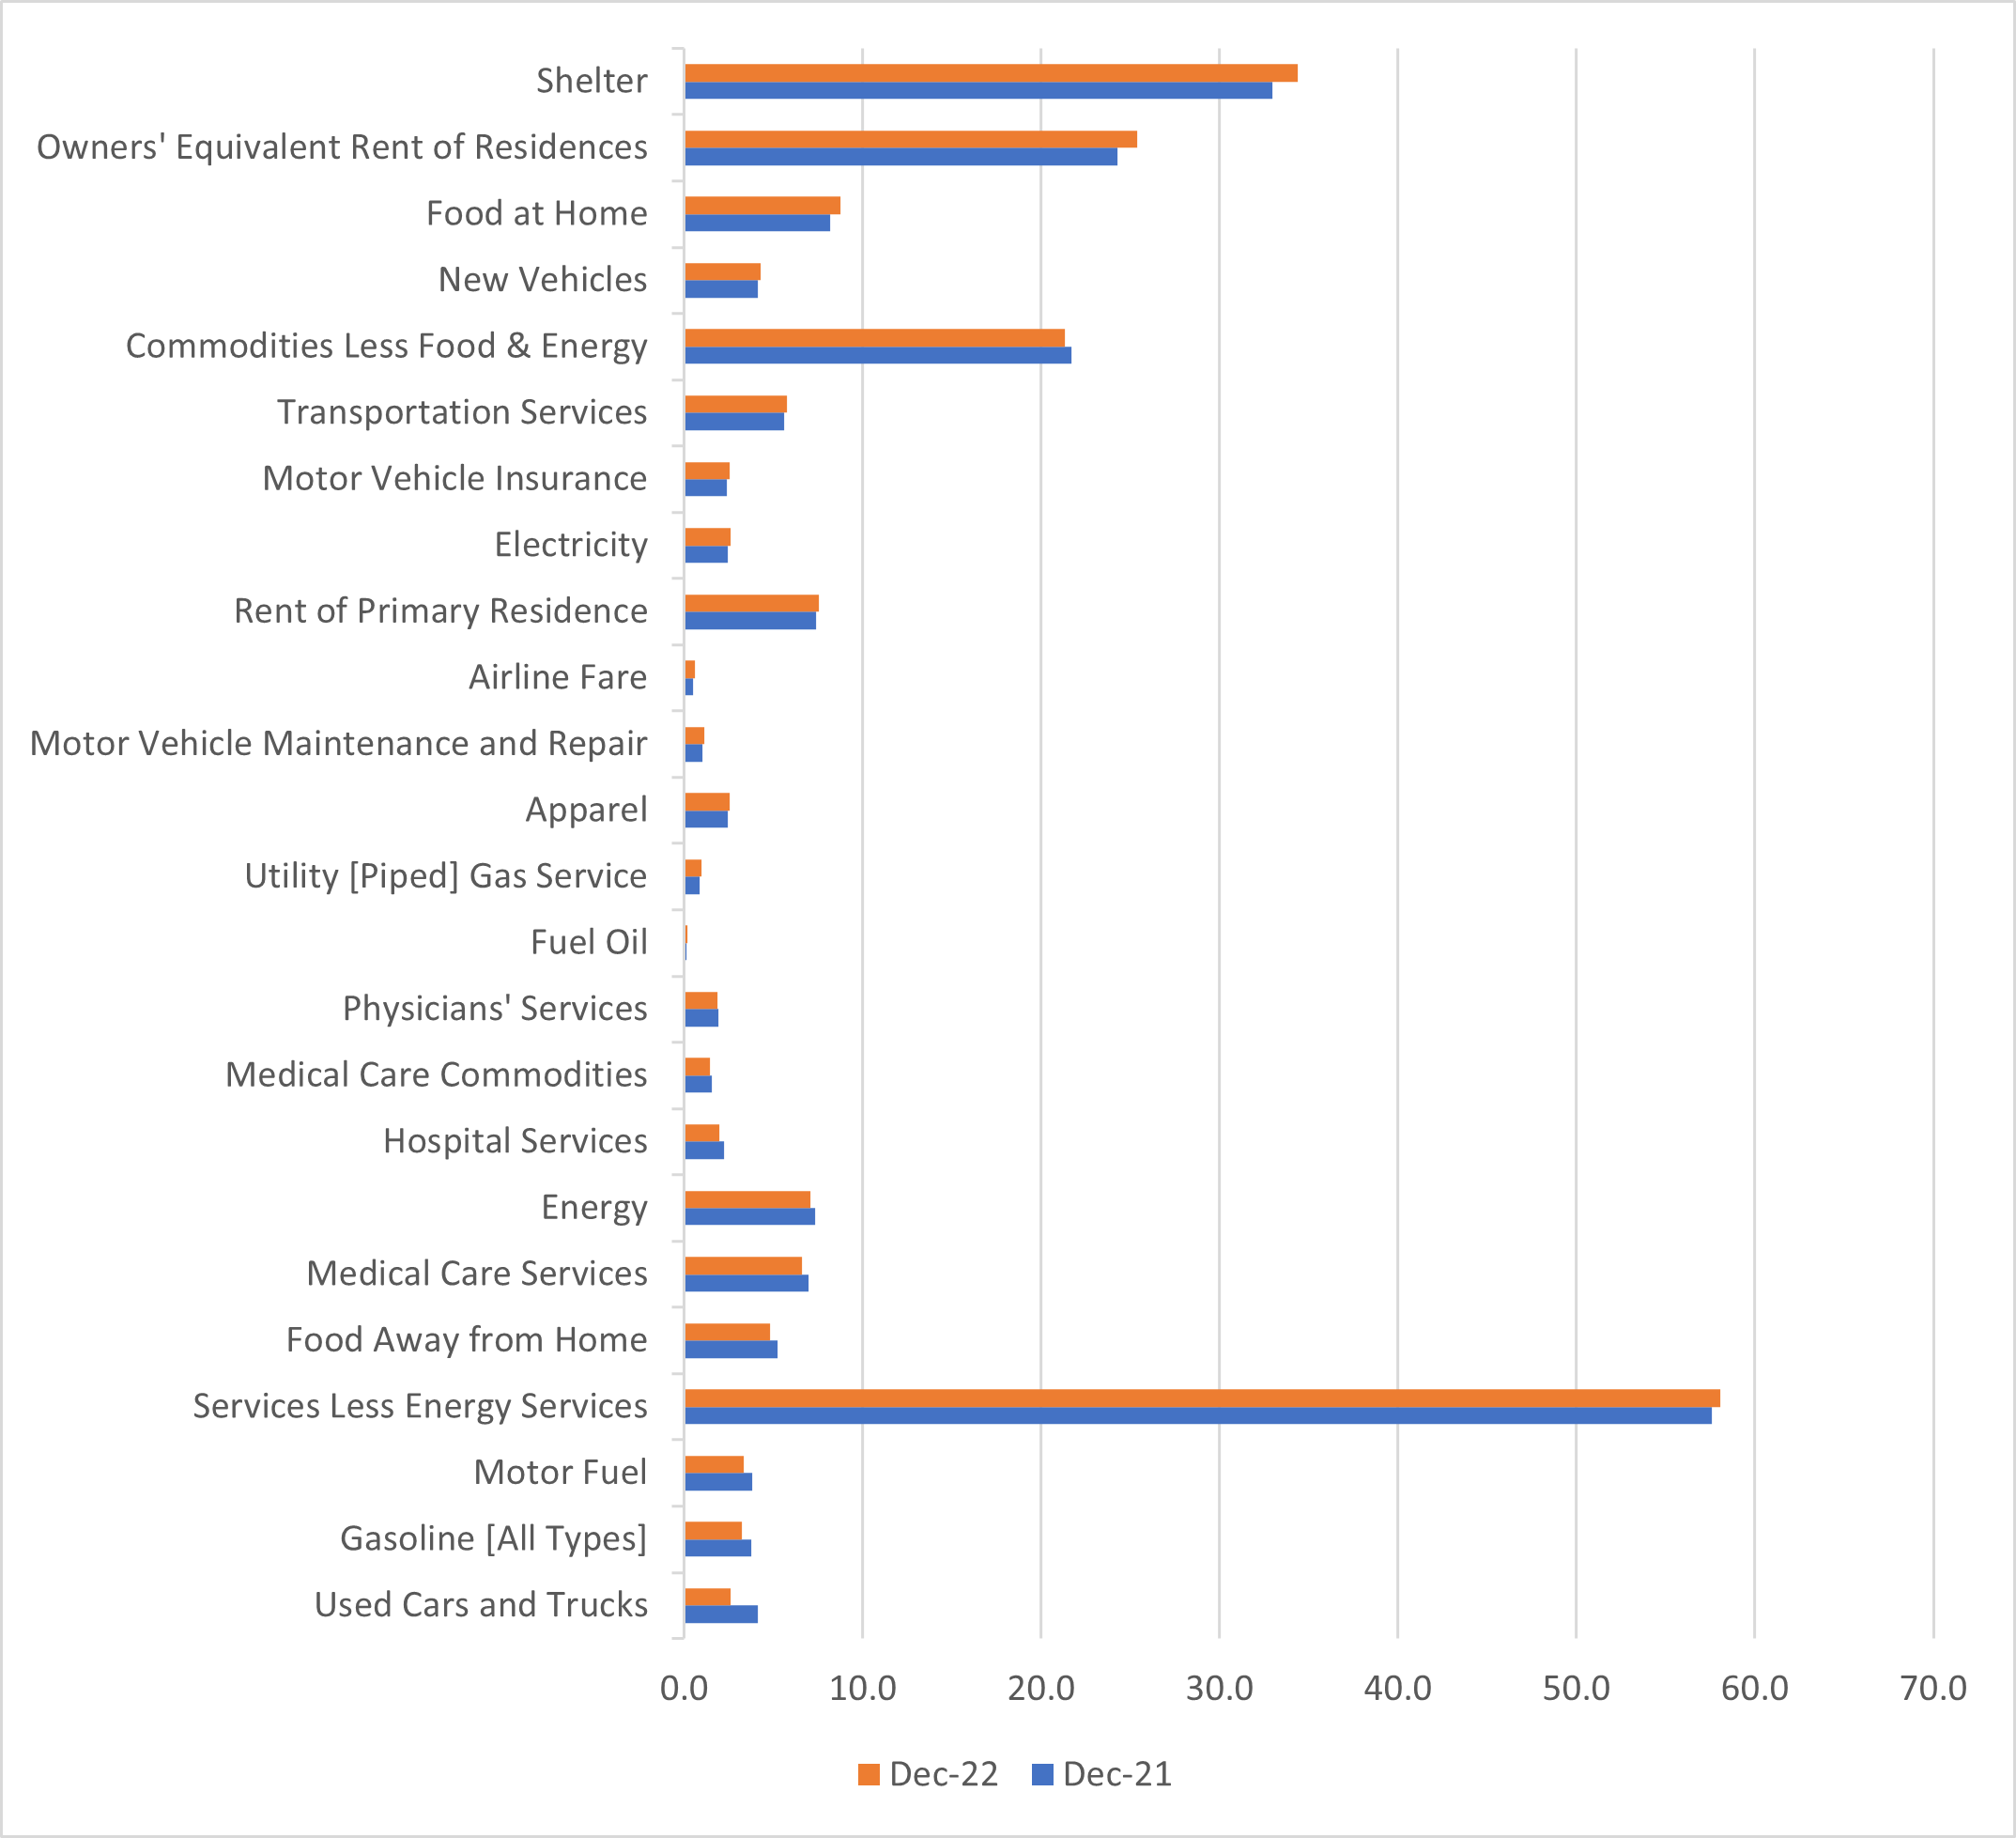
This bar chart shows the CPI’s category weights (“relative importance”), illustrating how heavily the overall CPI is influenced by large-budget items such as shelter. Because CPI is a weighted average, categories with larger weights contribute more to the all-items index when their prices change. Source
As a result:
Large price changes in heavily weighted categories move the CPI more.
Small price changes in lightly weighted categories move the CPI less.
Weights aim to reflect typical spending patterns, so the CPI approximates changes in the cost of living for the represented group.
The CPI formula you should know
The CPI is based on the cost of buying the same basket in different time periods.
= Consumer Price Index in year (index points)
= Total spending to buy the fixed basket using year prices (currency units)
= Total spending to buy the fixed basket using base-year prices (currency units)
Interpreting index points is straightforward: if , the basket costs 25% more than in the base period.
Interpreting movements in the CPI
A change in CPI indicates a change in the prices of the basket, so it is widely used to describe inflation experienced by consumers.
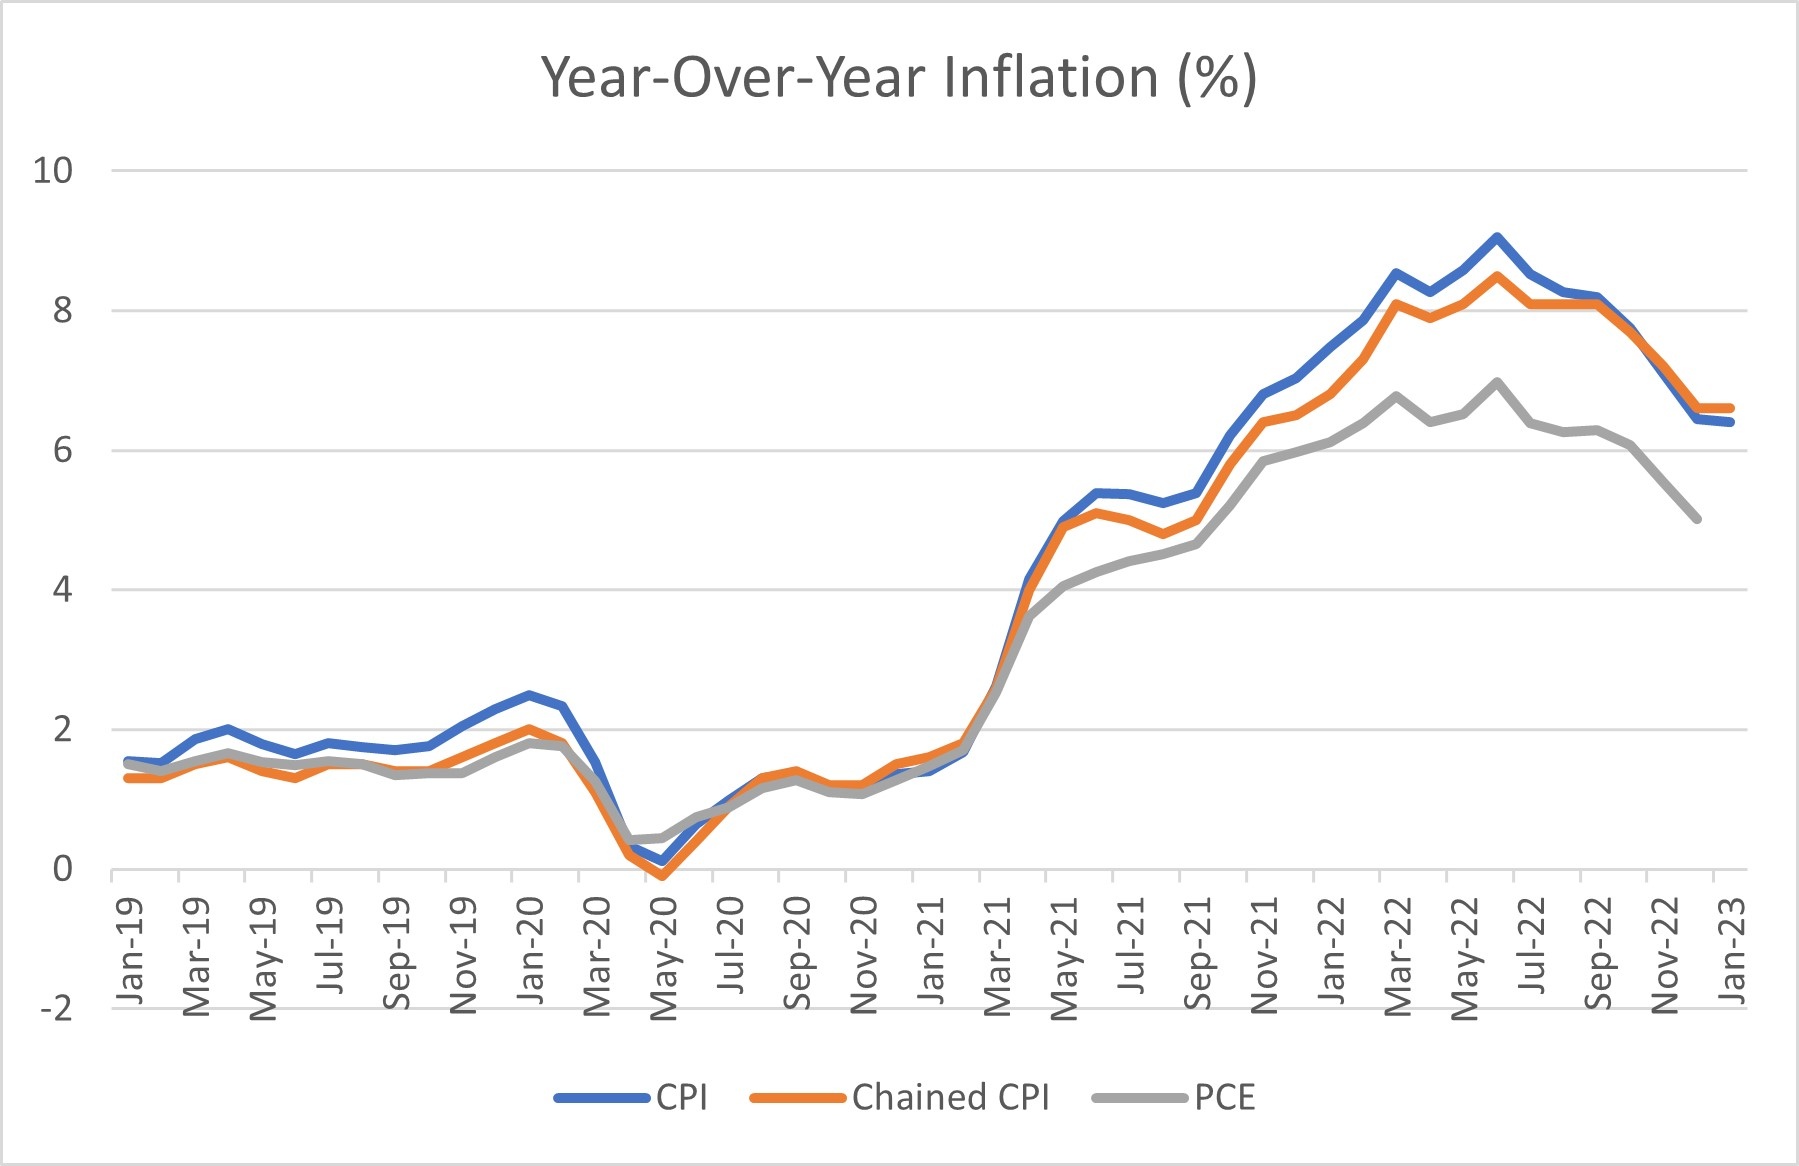
This time-series graph plots year-over-year inflation, which is a common way CPI data are summarized for headlines and policy discussions. The vertical axis measures the percent change over the past year, so higher points correspond to faster increases in the overall price level faced by consumers. Source
Key interpretations include:
Rising CPI: the basket’s cost is increasing; purchasing power tends to fall if incomes do not rise similarly.
Stable CPI: the basket’s cost is roughly unchanged.
Falling CPI: the basket’s cost is decreasing for the measured bundle.
Why the CPI matters in practice (without doing extra calculations)
CPI data are used to:
Track changes in the cost of living over time for households
Adjust some wages, pensions, and contracts via cost-of-living adjustments (COLAs) so payments keep pace with consumer prices
Provide a widely referenced benchmark for “inflation” in news, business planning, and policy communication
Practice Questions
Question 1 (3 marks) Define the Consumer Price Index (CPI) and explain what is meant by a “fixed basket” in its construction.
1 mark: CPI defined as an index measuring average changes in prices paid by consumers for goods and services over time.
1 mark: “Fixed basket” explained as a constant bundle/quantities of goods and services used for comparison across time.
1 mark: Link to purpose: isolating price changes (not changes in quantities/purchases).
Question 2 (6 marks) Describe how a statistical agency constructs the CPI and explain what an increase in the CPI implies for consumers’ cost of living.
1 mark: Identify that a representative basket of consumer goods/services is selected.
1 mark: Explain that items are weighted by typical household spending (expenditure shares).
1 mark: State that prices are collected over time for sampled items/outlets/locations.
1 mark: Explain aggregation into an index relative to a base period (base set to 100).
1 mark: Explain that a higher CPI means the basket costs more than before.
1 mark: Implication: cost of living rises and purchasing power falls if nominal incomes do not rise correspondingly.
FAQ
The base period is chosen for convenience and continuity, setting the index to 100 so later values are easy to interpret.
Changing the base period rescales the index but does not change measured inflation rates between the same two dates.
Weights are updated periodically to reflect changes in consumer spending patterns (e.g., new products, shifting budgets).
More frequent updates generally make the basket more representative of current consumption.
Core CPI excludes typically volatile categories (commonly food and energy) to provide a smoother signal of underlying inflation trends.
It is used as a supplementary indicator alongside headline CPI, not a replacement.
Statisticians use quality-adjustment methods to separate pure price changes from improvements in product characteristics.
One approach is hedonic adjustment, which estimates how much of a price difference reflects measurable feature changes.
Different groups buy different bundles and have different spending weights (e.g., commuters versus retirees), so their experienced inflation can differ.
Regional price levels and housing costs can also vary substantially, leading to different inflation experiences even within one country.
