
AP Syllabus focus: ‘Peaks and troughs represent turning points in the business cycle.’
Turning points are the moments when the economy changes direction. Understanding peaks and troughs helps you interpret macro data, explain shifting conditions, and connect real-world news to measured economic performance.
Turning points in the business cycle
A turning point marks the boundary between two different short-run directions of economic activity. In AP Macroeconomics, the core turning points are peaks and troughs, which identify when the economy stops improving and starts worsening (or vice versa).
What makes turning points important
Turning points matter because they:
Signal that the economy’s direction has changed, not just the pace of change
Help policymakers and firms recognise when conditions are deteriorating or recovering
Provide a timeline for comparing economic outcomes across different cycles (how long and how severe each episode is)
Peak (upper turning point)
A peak is the high point of economic activity before a downturn begins.
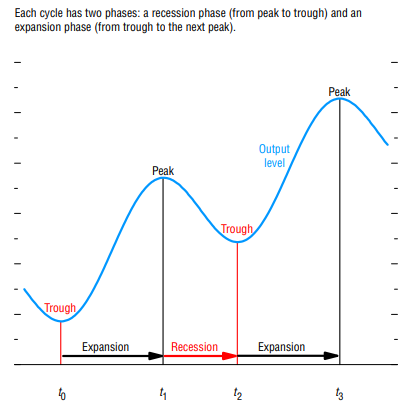
This diagram plots the level of output over time and marks the business cycle’s turning points: peaks (upper turning points) and troughs (lower turning points). It also labels the expansion phase (trough to peak) and recession/contraction phase (peak to trough), reinforcing that turning points are boundaries between short-run directions of activity. Source
Peak: The turning point at which economic activity stops rising and begins to fall, marking the start of a downturn.
A peak does not require that every indicator hits its maximum on the same date. Instead, it reflects a broader shift from improving conditions to worsening conditions across the economy. In practice, the economy may still look “strong” near a peak because many indicators lag behind the change in momentum.
What you typically observe around a peak
Real output stops rising consistently and begins to weaken
Employment conditions stop improving; job growth slows
Business sentiment and investment plans often become less optimistic
Some price measures may still be rising because inflation can lag changes in demand
Trough (lower turning point)
A trough is the low point of economic activity before a recovery begins.
Trough: The turning point at which economic activity stops falling and begins to rise, marking the start of a recovery.
A trough is not simply “the worst news headline.” It is the moment the economy transitions from contraction to expansion. As with peaks, different indicators may bottom out at different times, and some conditions (like unemployment) can keep worsening briefly even after the trough.
What you typically observe around a trough
Output stops declining and begins to stabilise
Firms slow the pace of layoffs; hiring may remain weak initially
Financial conditions and expectations may improve before “hard” data does
Consumer and business spending may begin to recover unevenly
How turning points are identified (conceptually)
Turning points are determined by evaluating broad, economy-wide patterns rather than a single statistic.
Because real economies are noisy, identifying a peak or trough is often clearer after additional data arrives.
Turning point: The moment when the economy shifts direction, from rising to falling activity (peak) or from falling to rising activity (trough).
Key practical issues when interpreting turning points:
Timing uncertainty: early data can be misleading, and the “true” turning point may be dated later.
Data revisions: GDP and other measures are frequently revised, changing the apparent timing.
Mixed signals: one indicator can improve while another worsens; turning points rely on the overall pattern.
Common AP misunderstandings to avoid
A peak is not “the highest level of GDP ever”; it is the point where the economy begins to weaken.
A trough is not “when unemployment is highest”; labour markets often lag the broader turning point.
Turning points describe a change in direction, not a guarantee of immediate, broad improvement.
Practice Questions
Question 1 (1–3 marks) Define a business cycle peak and a business cycle trough.
Peak defined as the turning point where economic activity stops rising and begins falling (1).
Trough defined as the turning point where economic activity stops falling and begins rising (1).
Clear identification that peaks and troughs are turning points in the business cycle (1).
Question 2 (4–6 marks) Explain two reasons why identifying the exact date of a peak or trough can be difficult using macroeconomic data.
Identifies a valid reason (1), such as data revisions / timing uncertainty / mixed signals across indicators.
Explains how it creates ambiguity about the turning point date (1).
Links to the idea that different indicators may peak/trough at different times or that early estimates can change (1).
FAQ
In the US, the National Bureau of Economic Research (NBER) Business Cycle Dating Committee dates peaks and troughs.
It uses multiple indicators (not only GDP) and makes determinations retrospectively.
Yes. A turning point can occur with modest changes if the direction shifts.
Small declines after a peak (or small rises after a trough) can still mark a turning point if the broader trend changes.
Employment is typically a lagging indicator.
Firms may wait for sustained improvement before hiring, so job losses can continue briefly even after output begins recovering.
A slowdown is reduced growth, but activity is still rising.
A turning point implies a change in direction—rising to falling at a peak, or falling to rising at a trough.
Early releases are based on incomplete information and later revisions can be substantial.
This can shift the apparent peak/trough date, making turning points clearer only after additional data accumulates.
