
AP Syllabus focus: ‘Potential output is the level of GDP when the economy is at full employment.’
Potential output and full employment connect the economy’s sustainable level of production to labour market conditions. Understanding these ideas helps distinguish temporary booms or recessions from long-run capacity and clarifies what “normal” unemployment looks like.
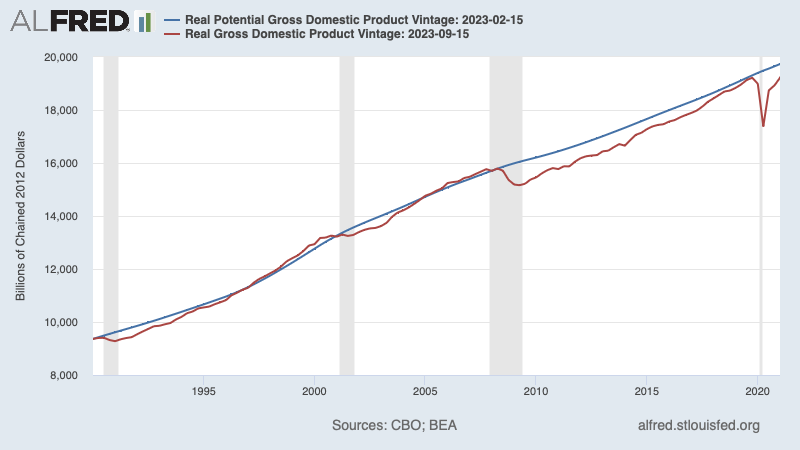
This time-series chart overlays real GDP (actual output) and real potential GDP (estimated sustainable output), so the vertical distance between the lines represents the output gap. Periods where real GDP falls below potential GDP correspond to recessions and rising cyclical unemployment, while periods near (or briefly above) potential indicate an economy operating at or beyond full employment. The figure helps connect “full employment” to the idea of producing near the long-run benchmark level of output. Source
Core ideas: potential output and full employment
Potential output (potential GDP)
Potential output refers to how much the economy can produce sustainably when resources are used at normal, long-run rates rather than overheated or depressed levels.
Potential output (potential GDP): The level of real GDP the economy can produce when operating at full employment, given existing technology, institutions, and available resources.
Potential output is not the maximum physically possible output; it is the level consistent with normal utilisation of labour and capital, where inflationary pressures are not driven persistently up or down by the state of the economy.
Full employment
Full employment links potential output to the labour market. It does not mean everyone has a job at all times; it reflects the idea that some unemployment is expected even in a healthy economy.
Full employment: A labour market condition in which real GDP equals potential output and unemployment reflects normal job search and job-matching frictions, not an economy-wide shortfall in spending.
At full employment:
Most unemployment is short-term search (people transitioning between jobs) or structural (mismatches of skills/locations).
The economy’s output is aligned with its productive capacity, so production does not require unusually high overtime, extreme capacity utilisation, or widespread difficulty hiring.
How potential output is determined in the long run
Productive capacity and long-run constraints
Potential output depends on the economy’s ability to supply goods and services over time. In AP Macroeconomics terms, it is shaped by the same forces that shift the economy’s long-run production possibilities.
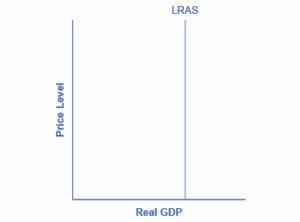
This aggregate demand–aggregate supply diagram shows the long-run aggregate supply (LRAS) curve as a vertical line at potential GDP. It visually reinforces that long-run real GDP is pinned to the economy’s productive capacity, while demand shifts mainly affect the price level in the long run. It also highlights that increases in productivity or resources shift the vertical LRAS line to the right over time. Source
Key determinants of productive capacity include:
Labour supply and quality
Size of the working-age population
Education, training, and health (human capital)
Work incentives and labour market institutions
Capital stock
Quantity and quality of machines, structures, and infrastructure
Maintenance and replacement of depreciated capital
Technology and productivity
Innovations and improved processes
Better management and diffusion of new technologies
Natural resources and energy availability
Rules and institutions
Property rights, regulation, and ease of starting/expanding firms
When these fundamentals improve, potential output tends to rise over time, allowing higher sustainable real GDP.
The long-run aggregate supply connection
In the long run, macroeconomic models treat potential output as the level of real GDP associated with long-run aggregate supply (LRAS).
Long-run aggregate supply (LRAS): A vertical aggregate supply relationship showing that, in the long run, real GDP is determined by potential output, not by the price level.
Interpreting LRAS in this context:
If the economy’s productive capacity expands (more resources or higher productivity), LRAS shifts right, indicating a higher potential output.
If productive capacity is damaged (e.g., reduced labour force participation or capital destruction), LRAS shifts left, indicating a lower potential output.
What full employment does (and does not) imply
Full employment is not zero unemployment
Even at full employment, unemployment can persist because:
Workers need time to search for jobs that fit their skills and preferences.
Firms need time to screen applicants and fill vacancies.
Structural changes can require retraining or relocation before workers are re-employed.
So, full employment is best understood as the economy operating without cyclical weakness in overall job availability.
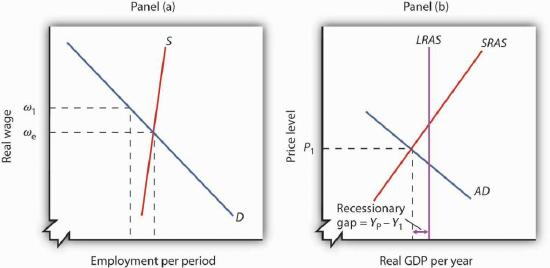
This diagram shows a recessionary gap in the AD–AS framework, where the short-run equilibrium level of real GDP lies to the left of potential output (the LRAS line). The shaded/labeled gap makes it clear that the economy can be below full employment in the short run because demand (or SRAS conditions) place equilibrium output below potential. It also sets up the long-run adjustment story: wages/prices adjust and SRAS shifts until output returns to potential. Source
Full employment as a sustainable benchmark
Full employment serves as a benchmark for “normal” economic performance:
Output is consistent with typical labour and capital utilisation.
Wage and price pressures stemming from demand conditions are not persistently extreme.
Policymakers often compare current conditions to full employment to judge whether the economy is running hot or slack.
Measuring and interpreting potential output in practice
Potential output is not directly observed
Potential output must be estimated, because it cannot be read directly from any single market transaction. Estimates rely on:
Data on labour force trends, capital accumulation, and productivity growth
Models that separate short-run fluctuations from long-run trends
Because it is an estimate, potential output can be revised as new data arrive or as productivity and labour market trends shift.
Potential output can change over time
Potential output is not fixed. It can increase with:
Higher productivity growth
Expanded labour force participation
Sustained investment that raises the capital stock
It can decrease (or grow more slowly) with:
Persistent skill erosion after long unemployment spells
Lower investment that reduces capital deepening
Demographic changes that shrink the labour force
Supply-side disruptions that permanently reduce capacity
Understanding these movements is essential for distinguishing a temporary downturn from a lasting change in the economy’s long-run capacity.
Practice Questions
(1–3 marks) Define potential output and state its relationship to full employment. (2 marks)
1 mark: Correct definition of potential output as the sustainable level of real GDP (or real GDP at full employment).
1 mark: Correct relationship: at full employment, real GDP equals potential output (or potential output occurs when the economy is at full employment).
(4–6 marks) Explain two factors that can increase potential output over time and explain how each factor affects the economy’s productive capacity. (6 marks)
1 mark: Identify first factor (e.g., increased capital stock, improved technology, higher labour force participation, better education/training).
2 marks: Explain how factor 1 raises productive capacity and increases sustainable real GDP (clear causal chain).
1 mark: Identify second factor (distinct from the first).
2 marks: Explain how factor 2 raises productive capacity and increases sustainable real GDP (clear causal chain).
FAQ
They can change how quickly workers and firms match.
Stricter licensing may reduce mobility across occupations, raising mismatch unemployment.
Stronger job protections may reduce job separations but also slow hiring.
The “full employment” benchmark can shift if these rules change job-finding rates.
Potential output is model-based and depends on trend productivity and labour supply.
Revisions happen when new data change measured productivity growth, participation trends, or capital stock estimates, which alters the inferred long-run path of sustainable GDP.
Yes. Technology is only one component of productive capacity.
Potential output can fall if the labour force shrinks, participation drops, capital stock is destroyed, or institutions reduce effective labour supply enough to outweigh productivity gains.
Many models treat full employment as the unemployment rate near a benchmark such as $u^*$.
If $u^*$ rises (e.g., due to higher mismatch), full employment can occur with a higher observed unemployment rate than before, even if the economy is not in recession.
Because “normal” unemployment differs across countries.
Differences in demographics, job-search systems, training pipelines, and labour market regulation can change the sustainable unemployment benchmark, so identical unemployment rates can imply different distances from full employment.
