
AP Syllabus focus: 'A normal curve is mound-shaped and symmetric. The parameters of a normal distribution are the population mean and population standard deviation.'
Normal curves are central to AP Statistics because their shape is predictable. Understanding the roles of mean and standard deviation helps you describe, compare, and interpret normal models accurately.
What a Normal Curve Looks Like
A normal curve is a smooth graph used to represent a distribution of quantitative data that follows a normal model. Its overall appearance is one of the most important features to recognize.
Shape and symmetry
A normal curve is mound-shaped, meaning it rises to a single high point in the middle and then falls away on both sides.
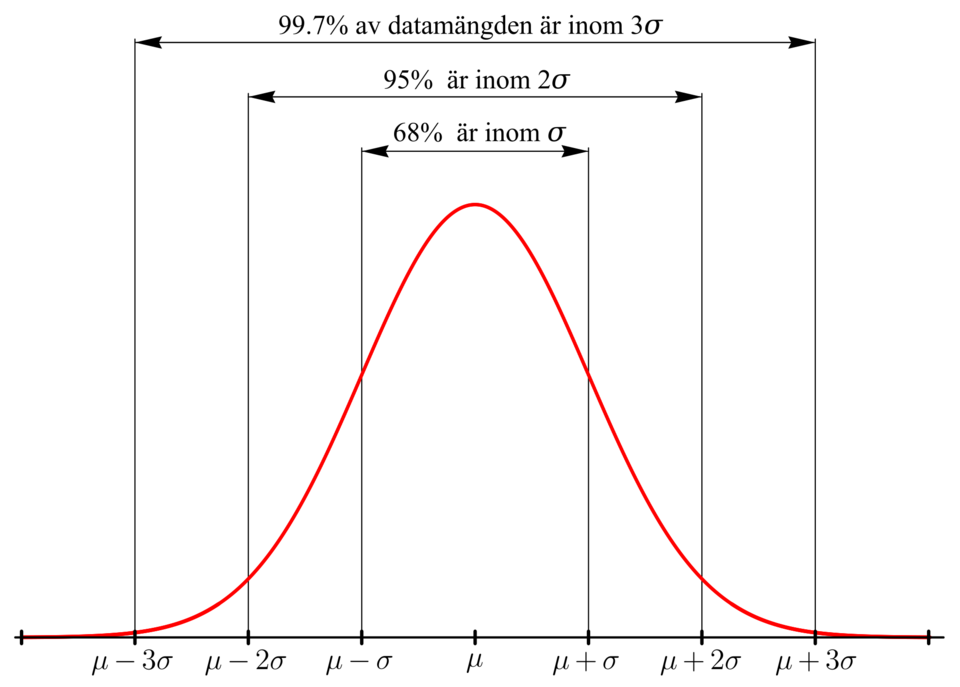
A normal curve partitioned into standard-deviation bands, with the central areas labeled (approximately 34.1%, 13.6%, etc.) to show how probability mass is distributed symmetrically around the mean. This visual supports interpreting spread via and recognizing that equal distances left/right of the center correspond to equal areas. Source
It is also symmetric, so the left half is a mirror image of the right half.
This symmetry has an important consequence: values equally far from the center appear with the same pattern on both sides of the curve. The curve does not lean more heavily to one side, so it is not skewed.
Tails of the curve
As you move farther from the center, the curve gets lower and lower. The ends of the graph are called the tails. In a normal model, the tails extend outward smoothly on both sides.
This shape matters because it tells you that most observations are near the center, while values far from the center are less common.
Normal curve: A smooth, symmetric, mound-shaped curve used to model some quantitative distributions.
The Population Mean as the Center
The population mean, written as , determines the location of the center of a normal curve. It identifies where the curve is balanced and where its highest point occurs.
For a normal distribution:
A normal curve with the peak at the center and several vertical guide lines marking positions at specific values on the x-axis. It helps students visualize that the mean identifies the balance point (and location of the peak), while distances from that center are the basis for talking about spread and standard-deviation units. Source
the mean is at the exact center of the curve
the curve peaks at the mean
half of the distribution lies to the left of the mean
half lies to the right of the mean
If the mean changes, the entire curve shifts horizontally. A larger mean moves the curve to the right, and a smaller mean moves it to the left. The overall shape does not change when only the mean changes.
Because the normal curve is symmetric, the center is especially important. It is the point around which the rest of the distribution is arranged. When describing a normal model, always identify the mean as the value that locates the distribution on the number line.
The Population Standard Deviation as the Spread
The population standard deviation, written as , controls how spread out the normal curve is. It tells you how tightly or loosely the values cluster around the mean.
A small standard deviation means:
values are packed closely around the mean
the curve is narrower
the curve is taller at the center
A large standard deviation means:
values are more spread out from the mean
the curve is wider
the curve is flatter at the center
So, while the mean tells you where the curve is centered, the standard deviation tells you how much variability there is around that center.
Population standard deviation: A parameter that describes the typical distance of population values from the population mean.
When comparing normal curves, differences in standard deviation are often visible even before any numbers are given. A narrow, steep curve has less spread than a wide, shallow curve.
The Two Parameters of a Normal Distribution
A normal distribution is completely determined by two parameters: and . Once these are known, the location and spread of the curve are fixed.
= population mean, the center of the curve, in the same units as the data
= population standard deviation, the spread of the curve, in the same units as the data
This notation emphasizes that every normal model is identified by its center and spread. Two normal curves with the same mean but different standard deviations will have the same center but different widths. Two normal curves with the same standard deviation but different means will have the same overall shape and spread, but one will be shifted horizontally.
If both parameters change, both the position and the spread change. Even then, the graph remains a normal curve: smooth, symmetric, and mound-shaped.
Describing Normal Curves Precisely
When you are asked to describe a normal distribution, focus on the features named in the syllabus.
Key points to mention
Shape: smooth, symmetric, and mound-shaped
Center: given by the population mean,
Spread: given by the population standard deviation,
A strong description should connect these ideas to the context of the variable. The mean and standard deviation are not just numbers; they describe where the distribution is centered and how much variation exists in the population.
What stays the same and what changes
For all normal curves:
the shape remains symmetric and mound-shaped
the center is determined by the mean
the spread is determined by the standard deviation
Changing shifts the curve left or right. Changing changes the width and height of the curve. These two parameters fully describe the normal model’s appearance.
Practice Questions
A population is modeled by a normal distribution with mean and standard deviation .
State the shape of the distribution and explain what the mean tells you.
1 mark for stating that the distribution is symmetric and mound-shaped
1 mark for stating that the mean gives the center of the distribution
Three normal distributions are defined below:
Distribution A: ,
Distribution B: ,
Distribution C: ,
(a) Compare the centers of A and B.
(b) Compare the spreads of A and B.
(c) Which distribution, A or B, would appear farther to the right on a graph?
(d) Compare A and C in terms of shape, center, and spread.
(a) 1 mark for stating that B has the larger center because
(b) 1 mark for stating that A and B have the same spread because both have
(c) 1 mark for identifying B as farther to the right
(d) 1 mark for stating that A and C have the same normal shape and the same center
(d) 1 mark for stating that C has greater spread, so it would be wider and flatter than A
FAQ
No. A distribution can look roughly symmetric and still fail to be truly normal.
A normal distribution has a very specific mathematical shape. In practice, statisticians often say a distribution is approximately normal when its graph is close enough to that shape for a normal model to be useful.
They are standard statistical symbols for population parameters.
$\mu$ represents the population mean
$\sigma$ represents the population standard deviation
Using these symbols helps distinguish population values from sample statistics, which are often written with different notation.
Because the normal curve is perfectly symmetric around its center.
In a normal model, the center is also the balancing point of the distribution. The density is greatest there, so the curve reaches its highest point at the mean.
Yes. If two normal curves have different means, different standard deviations, or both, they can cross.
For example:
one curve may be narrower and taller
another may be wider and flatter
Their graphs can intersect even though each curve is still normal.
Standard deviation measures distance from the mean, and distance cannot be negative.
If $\sigma=0$, every population value is the same
If $\sigma>0$, there is variability in the population
A negative standard deviation is impossible because it would not make sense as a measure of spread.
