
AP Syllabus focus: 'A standardized score, including a z-score, measures how many standard deviations a data value is above or below the mean.'
Standardized scores turn raw quantitative values into a common scale centered on the mean, making relative position easier to interpret and helping students describe how far a value lies from typical observations.
Understanding standardized scores
A standardized score describes a data value using the distribution’s center and spread instead of only the original measurement units.
Standardized score: A value that tells how many standard deviations an observation is above or below the mean of its distribution.
This idea matters because a raw value by itself does not show whether the observation is close to typical or far from the center. Standardization answers a relative-position question: where is this value compared with the rest of the distribution?
A common standardized score in AP Statistics is the z-score.
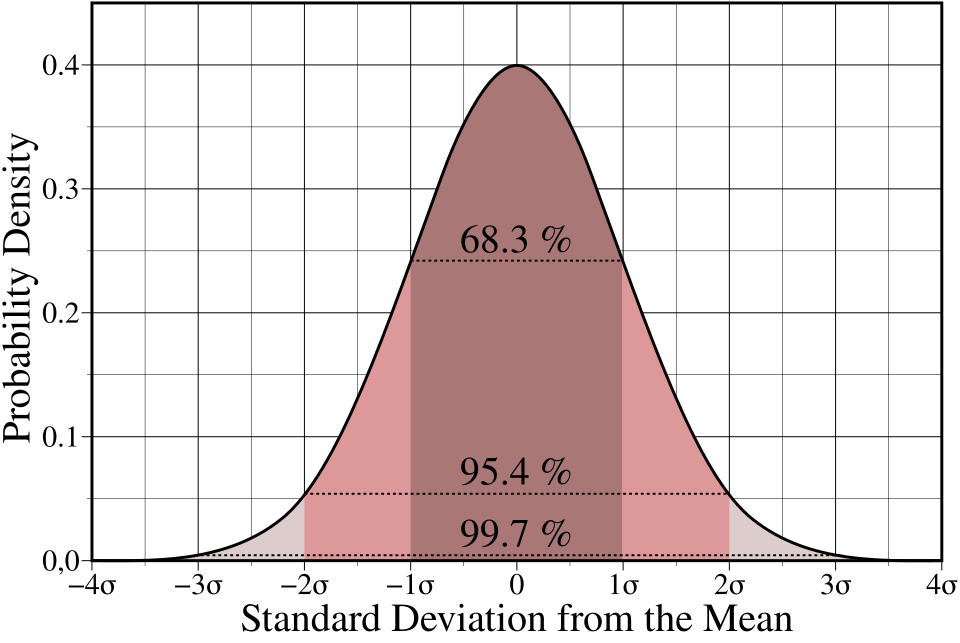
Standard normal (z) distribution with shaded regions, illustrating how specific z-values partition the area under the curve (probability). This helps connect a z-score’s position on the horizontal axis to the idea of relative location measured in standard deviations. Source
z-score: The standardized score obtained by subtracting the mean from a data value and dividing by the standard deviation.
The z-score uses the mean as the reference point and the standard deviation as the scale for measuring distance. Because of that, it turns many different raw scales into one common language for describing position within a distribution.
The standard formula is below.
= z-score with no unit
= observed data value in original units
= mean of the distribution in original units
= standard deviation of the distribution in original units
To compute a z-score, first find how far the value is from the mean, . Then divide that difference by the standard deviation. The result shows distance from the mean in standard deviation units rather than in the original units of the variable.
This formula is conceptually simple: subtract to locate the value relative to the center, then divide to judge whether that distance is small or large compared with typical variation. If a value is exactly one standard deviation above the mean, its z-score is . If it is two standard deviations below the mean, its z-score is .
Interpreting z-scores
Sign of the z-score
The sign tells direction relative to the mean.
A positive z-score means the value is above the mean.
A negative z-score means the value is below the mean.
A z-score of 0 means the value is exactly at the mean.
The sign should always be included in an interpretation. Saying only that a value is “2 standard deviations from the mean” leaves out whether it is above or below the mean.
Size of the z-score
The magnitude or absolute value of the z-score tells how far the observation is from the mean.
A z-score of means the value is 1 standard deviation above the mean.
A z-score of means the value is 1 standard deviation below the mean.
A z-score of means the value is closer to the mean than a z-score of .
A z-score of means the value is farther from the mean than a z-score of .
Larger absolute z-scores represent observations that are farther from the center of the distribution.
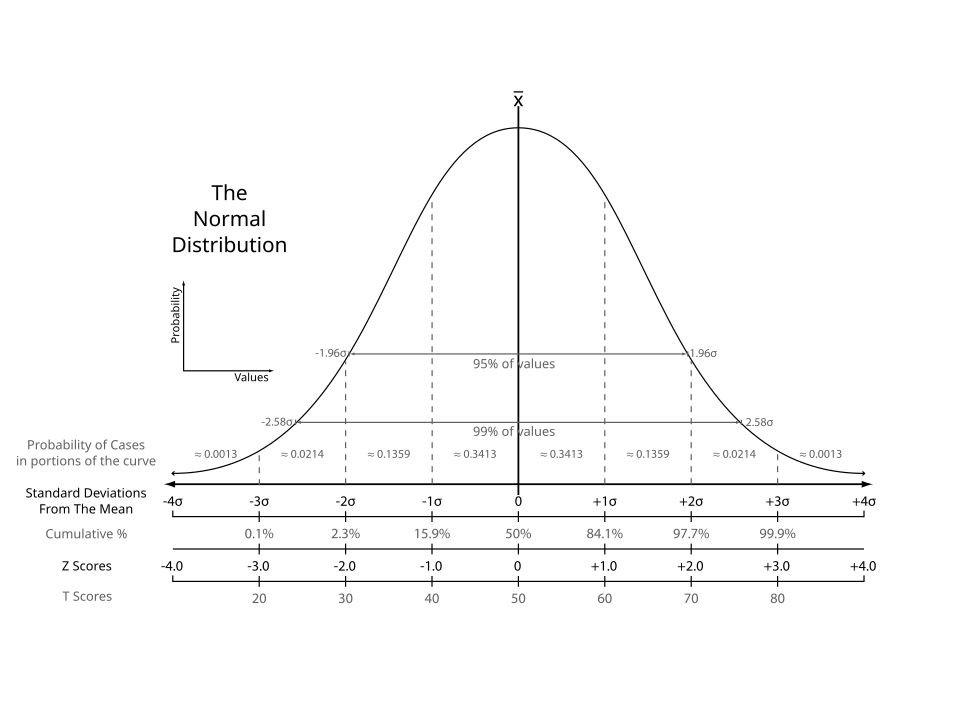
Normal-curve reference chart that aligns z-scores with standard-deviation cut points and cumulative percentages/percentiles. It supports interpretation by showing how increasing moves farther into the tails and corresponds to more extreme cumulative areas. Source
Smaller absolute z-scores represent observations closer to the mean. This is why z-scores are useful for describing relative position precisely and consistently.
Why standardizing helps
Raw values can be misleading when the scale of measurement has large or small typical variation. A difference of 5 units might be very large in one setting and very small in another. The z-score adjusts for that by measuring distance in standard deviation units.
Because standard deviation reflects the usual amount of spread in a distribution, the z-score tells whether a raw difference from the mean is small, moderate, or large relative to that spread. This makes the number much more informative than the raw value alone.
If every observation in a distribution is transformed into a z-score, the transformed distribution is centered at 0 and has standard deviation 1.
The overall pattern of the distribution does not change; only the scale used to describe location and spread changes.
Standardizing is therefore a way to rewrite data so that position becomes easier to interpret. The z-score does not replace the original value, but it adds meaning by showing how unusual or typical that value is compared with the mean and standard deviation of the distribution.
Good interpretation habits
When interpreting a z-score on AP Statistics problems, keep the language direct and contextual.
Refer to the data value and the mean.
State whether the value is above or below the mean.
State the distance in standard deviations.
Keep the interpretation tied to the variable being measured.
A strong interpretation explains relative position, not just arithmetic. For instance, the important idea is not merely that a formula was used, but that the observation lies a certain number of standard deviations above or below the center of the distribution.
A few common mistakes are worth avoiding:
Do not interpret a z-score as a raw difference in original units.
Do not drop the negative sign.
Do not use a z-score for a categorical variable; z-scores are for quantitative data.
Do not combine a mean from one distribution with a standard deviation from a different distribution.
Do not treat the z-score as a separate measurement unrelated to the original context.
A z-score is most informative when the mean and standard deviation correctly describe the same quantitative distribution as the observed value. When that connection is clear, the z-score gives a concise and powerful description of relative position.
Practice Questions
A distribution of test scores has mean 70 and standard deviation 8. A student scores 86.
Find the student’s z-score and interpret it.
1 mark for calculating
1 mark for stating that the score is 2 standard deviations above the mean
On a chemistry quiz, scores have mean 64 and standard deviation 6. Elena scored 73.
(a) Calculate Elena’s z-score.
(b) Interpret the meaning of Elena’s z-score in context.
(c) Another student has a z-score of . State whether that student’s score is above or below the mean, and find the student’s raw score.
1 mark for correct setup
1 mark for correct value
1 mark for stating that Elena’s score is above the mean
1 mark for stating that Elena’s score is 1.5 standard deviations above the mean
1 mark for finding the other student’s raw score:
FAQ
Yes. A z-score can be computed for any quantitative distribution that has a meaningful mean and a nonzero standard deviation.
Normality matters only when z-scores are later connected to probability statements or to a normal model. The act of standardizing a value does not require a normal distribution.
The numerator $x-\mu$ has the same units as the original variable, and the denominator $\sigma$ has those same units too.
When you divide one by the other, the units cancel. That is why a z-score is a pure number describing relative position rather than a measurement in points, inches, dollars, or seconds.
If $\sigma=0$, then every value in the distribution is the same as the mean, so there is no spread at all.
In that case, the z-score formula involves division by zero, so z-scores are undefined. If the standard deviation is extremely small, tiny raw differences can produce very large z-scores, so interpretation should be cautious.
Yes. There is no fixed upper or lower limit for a z-score.
Values beyond $\pm 3$ simply mean the observation is very far from the mean in standard deviation units. They may be uncommon in many real settings, but they are absolutely possible.
They can have the same z-score if each score is the same number of standard deviations from its own mean.
For example, one student could be 12 points above a mean with standard deviation 6, while another is 20 points above a mean with standard deviation 10. Both are 2 standard deviations above their means, so both have $z=2$.
