
AP Syllabus focus: 'Outliers are data points that are unusually small or unusually large relative to the rest of the data.'
Outliers can change how a data set is interpreted. In AP Statistics, you should recognize when a value stands apart from the main body of one-variable data and explain that observation clearly in context.
What is an outlier?
An outlier is not simply the highest or lowest value. It is a value that appears unusually far from most other observations in a distribution. The key idea is comparison: a point is called an outlier only by looking at how it relates to the rest of the data.
Outlier: A data value that is unusually small or unusually large relative to the rest of the observations in a data set.
A value can be extreme without being an outlier. If several observations stretch smoothly into a tail, the largest or smallest value may still fit the general pattern. By contrast, a single value separated from the main cluster by a noticeable gap is much more likely to be described as an outlier.
Outliers are relative to the distribution
Whether a value is an outlier depends on the overall spread and pattern of the data.
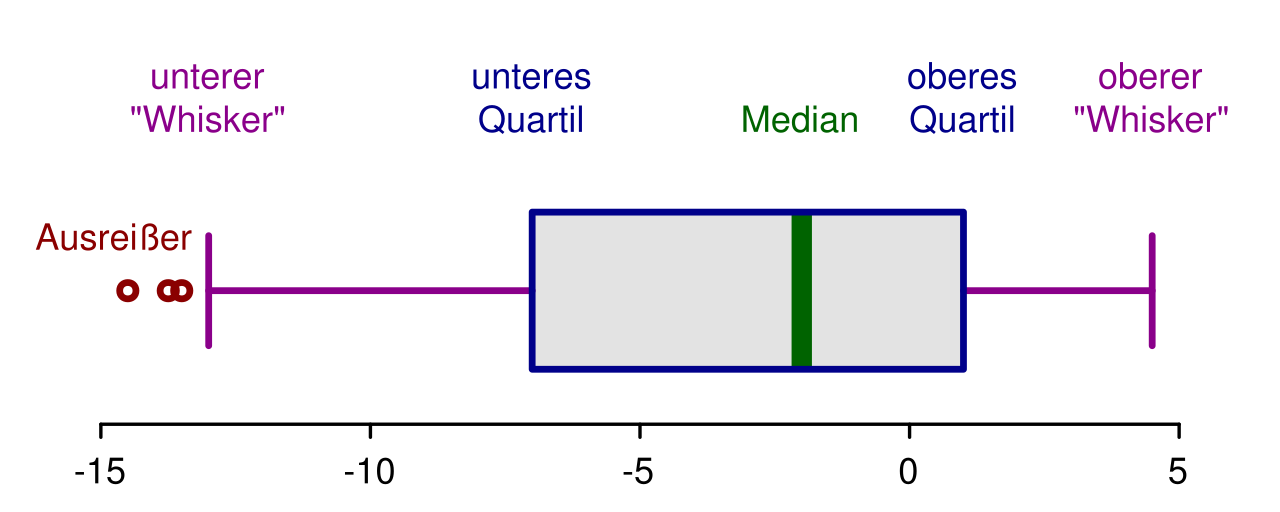
Annotated boxplot diagram labeling the quartiles, median, whiskers, and the plotting of outliers beyond the whiskers. This helps connect the definition of an outlier to the distribution’s structure—especially the idea that outliers are judged relative to typical spread, not just raw magnitude. Source
The same numerical value could be ordinary in one setting but unusually large in another. For this reason, you should avoid labeling a point as an outlier just because it “looks big” or “looks small” by itself.
When deciding if a value is an outlier, focus on questions such as:
Is the value far from the bulk of the data?
Is there a gap between that value and nearby observations?
Does the point fail to follow the overall pattern of the distribution?
Is the unusual value on the low end, the high end, or both?
This relative view is important because outliers are about position within the distribution, not just about raw size.
How outliers appear in one-variable data
Visual clues
Outliers are often easiest to notice in a graph. In a dotplot, an outlier may appear as a single dot far away from the others.
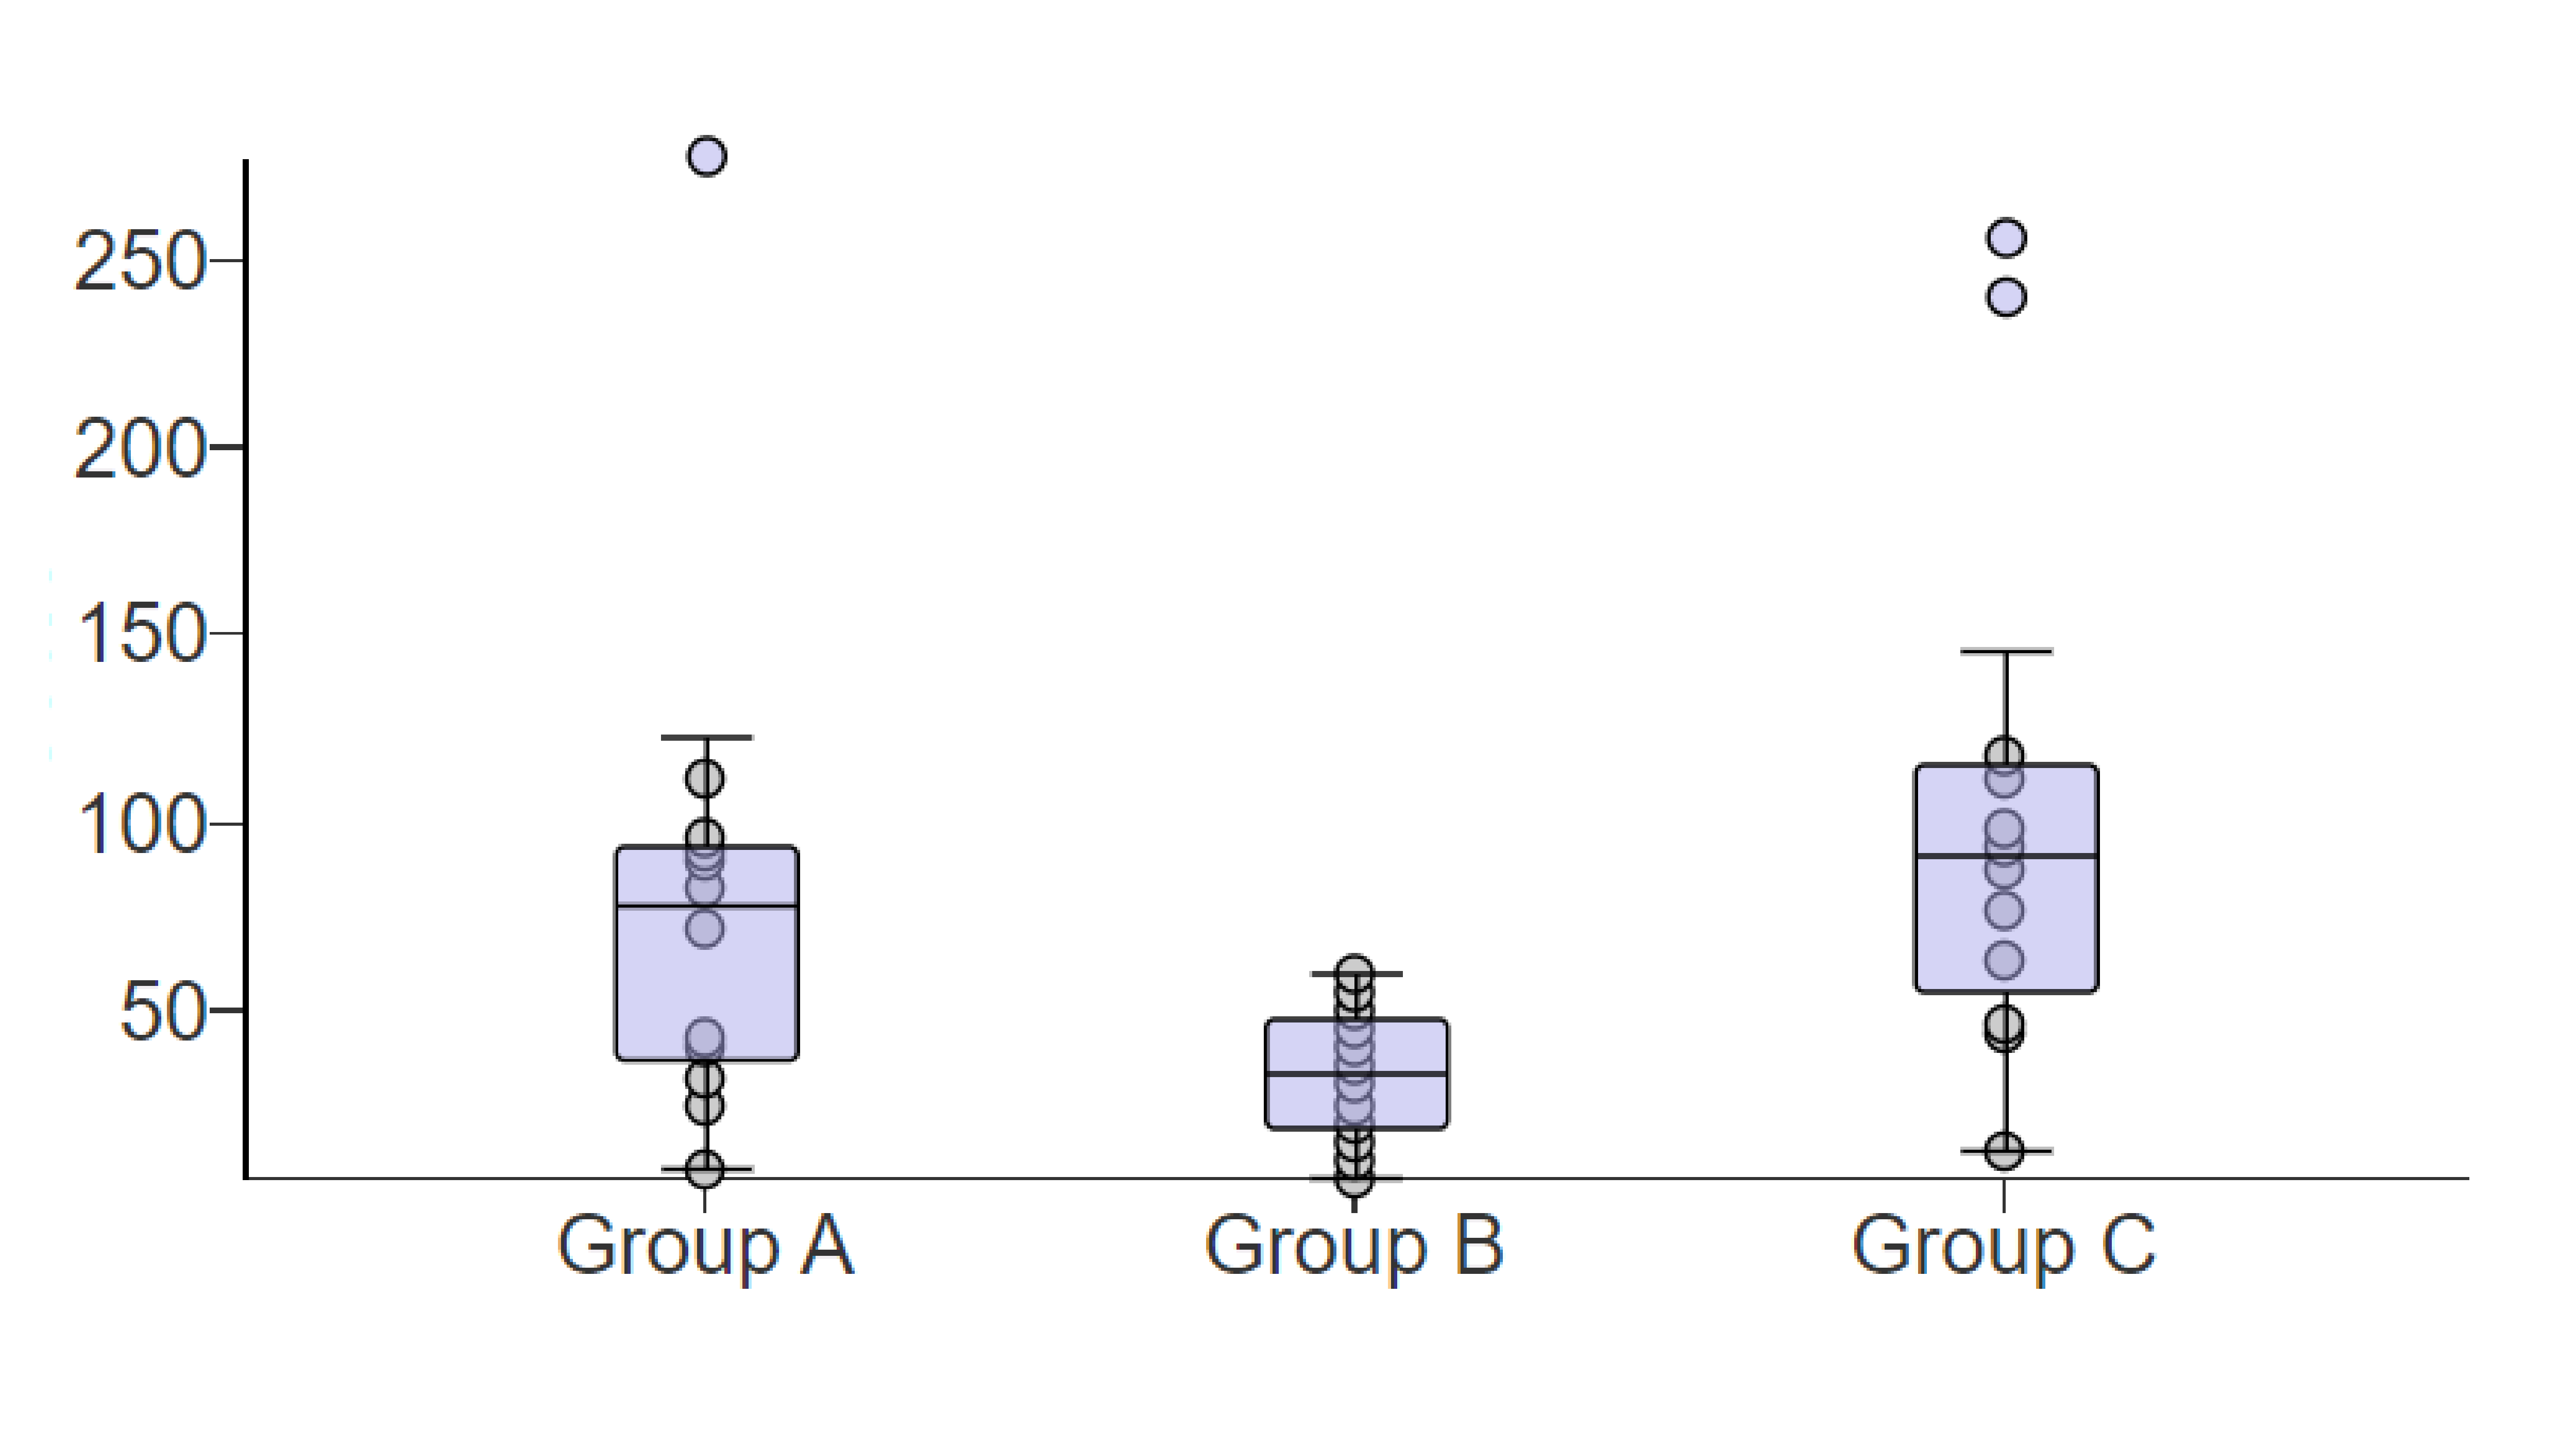
Example vertical box-and-whisker plots for three groups, with outliers drawn as points beyond the whiskers. The visual makes it clear that outliers are identified by their separation from the central 50% (the box) and from the non-outlier range (the whiskers), not merely by being the maximum or minimum value. Source
In a histogram, it may show up as a small count separated from the main concentration. In a stemplot or an ordered list, it may appear as a value with a large jump between it and the nearest observation.
Possible visual signs include:
one isolated point
a clear gap between an extreme value and the rest
an unusually long tail caused by just one or two observations
a low value or high value that does not match the main pattern
A graph helps because it shows the shape of the distribution, making it easier to judge whether an extreme observation is truly unusual or simply part of a longer tail.
Why outliers matter
Outliers deserve attention because they can affect how the entire data set is described. A single unusual point may change your impression of what is typical, how variable the data are, or whether the distribution seems balanced.
An outlier may suggest several different possibilities:
a recording or measurement error
an unusual but genuine individual
a change in conditions when data were collected
the presence of a different subgroup mixed into the data
a rare event that is still part of the process being studied
Because these possibilities have different meanings, it is important not to ignore outliers. They may be the most informative observations in the data set.
Describing outliers in context
What to include
On AP Statistics questions, you should describe outliers using the variable and its context. Avoid vague statements such as “there is a weird number.” Instead, identify whether the value is unusually small or unusually large and relate it to the rest of the distribution.
Good descriptions usually:
mention the variable being measured
indicate whether the outlier is high or low
compare it with the main cluster or bulk of the data
avoid claiming a cause unless the context supports one
A strong response explains that one observation is much larger or smaller than the rest of the recorded values for the variable being studied, rather than merely saying it is “different.”
Caution when interpreting outliers
Judging carefully
Outliers should be investigated, not automatically removed. A very large or very small value might be a mistake, but it might also represent real and important variation. If the value is legitimate, deleting it can distort the story told by the data.
It is also possible to overstate the importance of an outlier. In very small data sets, a value may seem isolated simply because there are few observations. In large data sets, a few unusual values may be expected. Context and careful judgment are both essential.
Another common mistake is to confuse a skewed distribution with an outlier. A long tail does not automatically mean there is an outlier. If observations gradually thin out toward one end, the extreme values may still be part of the overall pattern.
Outliers and the story of the data
An outlier does not automatically make a data set bad. Sometimes the unusual value is exactly what the investigation cares about, such as an exceptionally long wait or an exceptionally low result. In those cases, the outlier may reveal risk, inequality, or an important process change.
Still, one unusual observation should not lead to broad claims by itself. It signals that the analyst should look more carefully at the data source, the units, and the collection conditions. Good interpretation balances skepticism with openness: the point may be wrong, or it may be the most meaningful part of the distribution.
Common language for AP responses
When writing about outliers, use direct statistical language. Helpful phrases include:
“There is a possible high outlier.”
“There appears to be an unusually small observation.”
“One value is separated from the rest of the distribution.”
“The distribution has no obvious outliers.”
“A low outlier may indicate an unusual case or possible error.”
These statements are strongest when paired with context. The goal is not just to spot an unusual value, but to explain why it stands out relative to the rest of the data set.
Practice Questions
A dotplot of the number of absences in a class shows that most students had between 0 and 6 absences, but one student had 18 absences. Describe the unusual feature in the distribution. (2 marks)
1 mark: Identifies 18 absences as a possible high outlier.
1 mark: Justifies that it is unusually large relative to the rest of the class or clearly separated from most observations.
A school records the travel time, in minutes, for students getting to school. Most observations are between 8 and 30 minutes, there is a small gap after 30 minutes, and there is one observation at 52 minutes. (5 marks)
(a) Describe the outlier, if any, in context. (b) Give one plausible explanation for this value. (c) Explain why the value should not automatically be removed from the data set. (d) Explain one way this value could affect the overall description of the distribution.
1 mark: States there is a possible high outlier at 52 minutes.
1 mark: Describes it in context as an unusually long travel time compared with the rest of the students.
1 mark: Gives a plausible explanation, such as an unusually long commute, traffic delay, or recording error.
1 mark: Explains that it should not be removed automatically because it may be a real observation.
1 mark: Explains that it could make the distribution appear more spread out or make the high end seem more extreme.
FAQ
Yes. A small group on one end can be unusual even if the points are close to one another. In that case, the issue is not a single isolated observation but a small cluster separated from the main body of the data.
If those values blend gradually into the rest of the distribution, they are less convincing as outliers. The separation from the main pattern is what matters most.
Masking happens when one extreme value makes another unusual value harder to notice. For example, if two very large observations occur together, each one may look less isolated because the other is nearby.
This matters because a quick graph reading can underestimate how unusual part of the distribution really is. After investigating one extreme point, it is often worth checking whether another unusual point becomes more obvious.
Yes. Extra zeros, misplaced decimals, switched digits, or inconsistent units can create values that look extreme but are not real. Rounding can also make most observations pile up at common values, making one unrounded value seem suspicious.
Before interpreting an outlier, check:
units
decimal placement
coding rules
whether values were rounded the same way
Yes. Variables with a natural lower limit but no strict upper limit often produce more unusually large values. Examples include waiting times, incomes, and counts of rare events.
In highly controlled measurement settings, real outliers may be less common, so an extreme value may raise stronger concerns about error. The type of variable and the data-collection process both matter.
An outlier can trigger follow-up action even before any formal statistical modeling. A school may review one unusually long commute, a hospital may investigate one very long wait, or a company may inspect one unusually heavy package.
In practice, outliers can:
reveal safety issues
identify unusual individuals who need support
expose data problems
flag process failures
So an outlier is not just a mathematical curiosity; it can affect what someone does next.
