
AP Syllabus focus: 'Descriptive statistics do not attribute sample properties to a larger population, but they may provide the basis for later conjectures and testing.'
Descriptive work is the starting point of statistical thinking. It helps you notice patterns in observed data, but AP Statistics expects you to separate careful description of a sample from claims about a population.
What descriptive statistics do
Descriptive statistics summarize the data that were actually collected. They help organize information, reveal patterns, and support statements about the observed sample.
Descriptive statistics: Numerical summaries and graphical displays used to organize, summarize, and describe a set of observed data.
In AP Statistics, descriptive statistics include statements about features such as shape, center, spread, and unusual features.
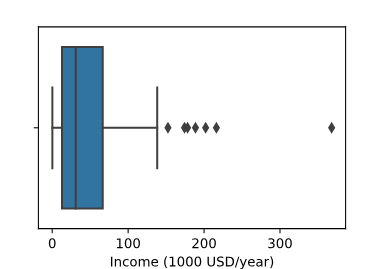
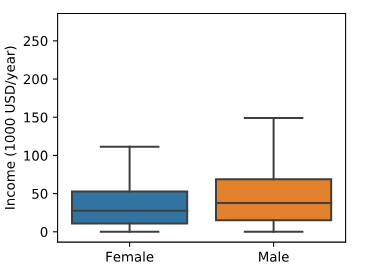
Example boxplots illustrate how a distribution can be summarized using quartiles, the median, and whiskers, with outliers flagged as individual points. The plot makes it easy to discuss center (median), spread (IQR), and skew in a purely descriptive way—i.e., as features of the observed sample. Source
These descriptions are valuable because they turn raw data into meaningful information. For example, a graph might show that values cluster in one region, or a numerical summary might show that observations vary widely.
The key limitation is scope. A descriptive statistic is about the data in hand. If a sample has a high median or a right-skewed distribution, that tells you something about that sample. By itself, it does not prove that the same feature holds for a larger population.
Why description is not the same as generalization
A common error is to treat a sample summary as if it were automatically a fact about the whole population. That is stronger than descriptive statistics allow.
This caution comes from sampling variability: different samples from the same population can produce different summaries.
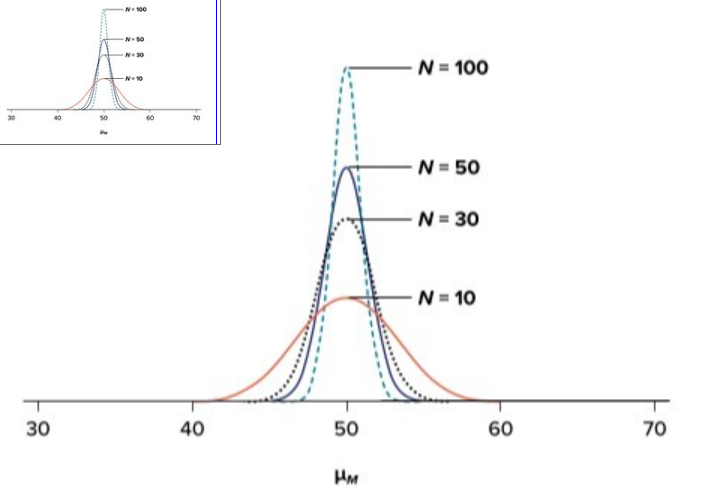
This figure compares sampling distributions generated from the same population under different sample sizes. It visually demonstrates sampling variability (the natural differences from sample to sample) and how larger typically yields less variable sample statistics. Source
Sampling variability: The natural tendency of sample results to differ from one sample to another, even when the samples come from the same population.
Because of sampling variability, one sample cannot fully determine what is true for all individuals in a larger group. A sample mean, sample median, or sample graph may be informative, but it is still based on only part of the population. Chance alone can make one sample look somewhat different from another.
This means that descriptive statistics do not justify statements such as:
“The population definitely has this shape.”
“All members of the larger group behave this way.”
“This sample proves the population mean is high.”
Those claims go beyond description and move into inference, which requires additional reasoning and methods.
Language that stays within descriptive statistics
When writing about data, it is important to match your wording to what the evidence actually supports. Stronger wording than the data justify is a statistical mistake.
Appropriate descriptive language usually:
names the sample or observed group
refers to what was seen in the data
avoids claiming certainty about a broader population
keeps the statement tied to the original context
Useful phrases include:
In this sample
Among the observed data
The distribution appears
The sample suggests
The data show for these individuals
Less appropriate phrases include:
This proves the population
All individuals in the population
The larger group is definitely
This establishes that everyone
The difference is not just wording. It reflects a real distinction between describing observations and drawing conclusions beyond them.
How descriptive statistics lead to conjectures
Although descriptive statistics do not establish population facts, they are often the reason statisticians ask new questions. A visible pattern may motivate a conjecture.
Conjecture: A tentative, evidence-based idea or claim suggested by observed data that may be examined more formally later.
A conjecture is weaker than a conclusion. It is a reasonable possibility suggested by the data, not a result that has already been confirmed. For example, an unusual cluster, a strong skew, or an unexpectedly high center may lead someone to wonder whether a similar pattern exists more broadly.
This is why descriptive statistics are so important: they often provide the basis for later work. They help identify what might be true, what seems worth investigating, and what should be tested more carefully. In AP Statistics, that later step involves methods designed to assess whether a broader claim is supported, rather than merely suggested.
Good practice when moving from description to conjecture
A careful student separates three levels of thinking:
Observed fact: what the sample data show
Tentative idea: what the pattern may suggest
Established conclusion: what would require further statistical evidence
To use descriptive statistics responsibly:
describe the sample clearly and specifically
keep every claim connected to the observed data
treat interesting patterns as starting points, not final proof
use cautious language when mentioning broader possibilities
recognize that further evidence is needed before attributing a sample property to a larger population
A strong AP Statistics response shows this distinction clearly. It does not understate the value of descriptive statistics, but it also does not overclaim. Good statistical reasoning begins with careful description and then moves, when appropriate, toward later conjectures and testing.
Practice Questions
A researcher records the commute times of 25 teachers at one high school and finds a mean commute time of 18 minutes. A student writes, “Teachers in the district have a mean commute time of 18 minutes.”
Explain why this statement is not justified by descriptive statistics alone.
1 mark: States that 18 minutes describes only the sample of 25 teachers observed.
1 mark: Explains that this sample result cannot automatically be attributed to all teachers in the district without additional statistical evidence or inference.
A counselor surveys 40 students in one AP Statistics class about hours of sleep on school nights. The data are summarized as follows: median = 6.5 hours, IQR = 1.0 hour, and the distribution is skewed right with a few unusually large values.
(a) Write two correct descriptive statements about the data. (b) The school newsletter says, “Students at this school do not get enough sleep because the sample median is 6.5 hours.” Explain why this claim goes beyond descriptive statistics. (c) State one reasonable conjecture that could be investigated later, and name one additional step needed before making a conclusion about the whole school.
1 mark: Gives one correct descriptive statement tied to the sample, such as the median is 6.5 hours.
1 mark: Gives a second correct descriptive statement tied to the sample, such as the middle 50% span about 1 hour or the distribution is skewed right with a few high values.
1 mark: Explains that the newsletter is making a claim about the whole school, not just the sampled class.
1 mark: Explains that descriptive statistics alone do not justify that broader conclusion.
1 mark: Gives a reasonable conjecture and identifies a needed next step, such as collecting a representative schoolwide sample or using formal inference.
FAQ
No. If the data truly include every individual in the defined population, then the summaries describe that population directly.
The important issue is whether the population was defined correctly. A data set may look complete but still leave out:
people absent at the time of collection
later time periods
groups not included in the definition
So descriptive statistics can describe a population exactly, but only when the data really are a full census of that population.
A conjecture is usually an informal, tentative idea suggested by the data.
A hypothesis is a more formal statement written so it can be tested statistically.
In practice:
descriptive statistics may lead you to a conjecture first
that conjecture can later be translated into a hypothesis
the hypothesis is what gets evaluated with formal statistical methods
So a conjecture is often the earlier, less formal stage of statistical reasoning.
Yes. The same data can suggest different ideas depending on how they are displayed.
For example, changes in:
scale
bin width
axis limits
grouping choices
can make a pattern seem stronger, weaker, smoother, or more irregular.
That does not mean graphs are unreliable. It means conjectures should be based on thoughtful viewing of the data, not on a single display treated as unquestionable. Good practice is to examine the data in more than one reasonable form before making a strong conjecture.
More decimal places increase numerical detail, not statistical justification.
A sample mean reported as 6.4375 is still a sample mean. It may look precise, but that precision only describes the calculation from the observed data.
It does not solve bigger issues such as:
whether the sample is representative
how much sampling variability is present
whether the pattern would repeat in other samples
So apparent precision should not be confused with valid generalization.
A conjecture must match the population you actually want to talk about.
For example, a conjecture based on one class might be reasonable for “students in this class this semester,” but much less reasonable for “all teenagers in the state.”
As the target population gets broader, the evidence usually becomes less directly connected to it.
Before accepting a conjecture, ask:
Who exactly is the population?
How similar are they to the observed sample?
Does the sample give relevant evidence for that group?
A vague population definition often leads to overclaiming.
