
AP Syllabus focus: 'A distribution is skewed right when the right tail is longer, skewed left when the left tail is longer, and symmetric when halves mirror.'
Recognizing skewness and symmetry helps you describe a quantitative distribution accurately. These shape descriptions focus on the pattern of values in a graph, especially the tails and the overall balance around the center.
What these terms mean
When statisticians describe the shape of a distribution, they look at how observations are spread across the scale of a quantitative variable. One key feature is whether the distribution is balanced or whether it stretches farther on one side than the other.
A tail is the thinner, more extended part of a distribution where fewer observations appear.
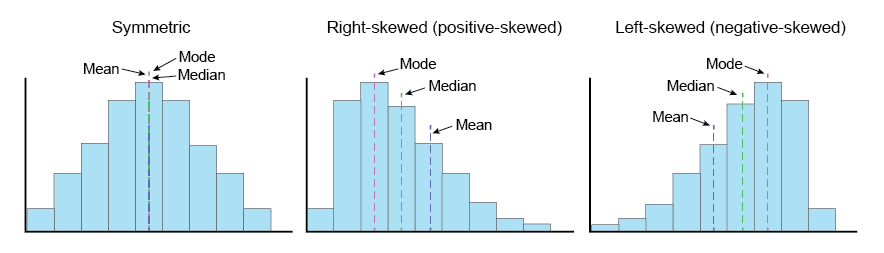
Three histograms are shown side-by-side to compare symmetric, right-skewed, and left-skewed shapes. The figure emphasizes that skewness is identified by the direction of the longer tail, not by the location of the tallest bars. Use it as a quick visual checklist when describing distribution shape from a histogram. Source
The direction of skewness is determined by the direction of the longer tail, not by the side containing most of the data.
Skewed right: A distribution with a longer tail on the high-value side.
This is also called right-skewed or positively skewed in some textbooks.
Skewed left: A distribution with a longer tail on the low-value side.
This is also called left-skewed or negatively skewed.
Symmetric distribution: A distribution whose left and right sides are approximately mirror images around the center.
In AP Statistics, these terms are usually applied by looking at a graph of a quantitative distribution rather than from a formula or numerical rule alone.
Identifying skewed right distributions
A distribution is skewed right when values trail off farther to the right.
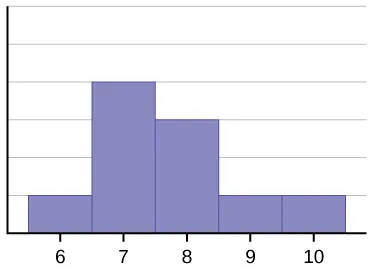
This textbook histogram is an example of a right-skewed distribution, where the bars taper off toward larger values on the right. The extended right tail shows that a small number of higher observations stretch the distribution on the high-value side. This is the visual evidence you would cite on an AP Statistics response when labeling a graph as skewed right. Source
That means the larger values are more spread out, creating a longer tail on the high end of the scale.
Common visual clues include:
most observations grouped in the lower or middle part of the scale
a gradual stretch toward larger values
a right tail that extends farther than the left tail
The key idea is that a few relatively large observations pull the shape outward on the right side. Even if the main cluster is located on the left or middle, the distribution is named by the tail, not by the cluster.
When writing a statistical description, it is better to say “the distribution is skewed right” than to say “the data go up on the right.” The AP exam rewards clear shape language.
Identifying skewed left distributions
A distribution is skewed left when values trail off farther to the left. The smaller values are more spread out, so the low end of the scale has the longer tail.
Common visual clues include:
most observations grouped in the upper or middle part of the scale
a gradual stretch toward smaller values
a left tail that extends farther than the right tail
This shape can be harder for students to spot because many people first notice where the graph is tallest. However, the tallest part does not determine the direction of skewness. The longer tail does.
If you are unsure, mentally compare the distance from the center to each end of the distribution. The side that stretches farther usually indicates the skew.
Identifying symmetric distributions
A distribution is symmetric when the two sides are approximately balanced around a center. If you imagine folding the graph at its center, the left and right sides would look roughly alike.
A symmetric distribution does not need to be perfectly identical on both sides. In real data, small irregularities are normal. What matters is the overall pattern:
the left and right tails are about the same length
the graph shows similar spread on both sides of the center
neither side has a clearly longer tail
Small departures caused by random variation do not automatically destroy symmetry. On the AP exam, words such as approximately symmetric are often more appropriate than perfectly symmetric.
How to describe skewness from a graph
When viewing a histogram, dotplot, or similar display, use a consistent process:
find the general center of the distribution
examine how far the graph extends to the left and right
compare the tails rather than just the tallest bars or stacks
decide whether one tail is noticeably longer or whether both sides are similar
Look past small random bumps and focus on the overall outline. A careful description should connect the shape word to the visual evidence. For instance, if you call a distribution skewed right, your justification should mention the longer right tail. If you call it symmetric, your justification should mention the roughly mirror-like halves or similar tail lengths.
Avoid relying on vague statements such as “it looks uneven” or “it leans.” Shape descriptions should be specific enough that another student could understand exactly what feature you noticed.
Common interpretation errors
Several mistakes appear often in introductory statistics:
Confusing skewness with where most observations are. A distribution can be skewed right even when most observations are on the left.
Naming the skew by the short tail. The direction is always based on the longer tail.
Assuming symmetry means perfect sameness. Real data are rarely exact mirror images.
Using shape words without evidence. On AP questions, the description should be tied to the graph’s visible form.
If the tails are very close in length, do not force a strong skew label. It is often better to describe the distribution as roughly or approximately symmetric when the visual evidence is mixed.
Writing strong AP Statistics descriptions
When justifying a claim, keep your wording direct and statistical. If the evidence is weak, qualify the statement with words such as slightly or approximately.
Skewed right because the right tail is longer.
Skewed left because the left tail is longer.
Approximately symmetric because the two sides are roughly mirror images and the tails are similar in length.
Using these exact ideas helps keep your response aligned with the AP Statistics definition of skewness and symmetry.
Practice Questions
A distribution has most observations between 4 and 9, with a few larger observations stretching out to 18. Describe the shape of the distribution and justify your answer.
1 mark for identifying the distribution as skewed right or right-skewed
1 mark for stating that the tail is longer on the high-value side or extends farther to the right
A histogram of quiz completion times is described as follows: most observations are centered around 22 minutes. The bars decrease in a similar way on both sides of 22, and the distribution extends to about the same distance on the low and high ends.
(a) Describe the shape of the distribution. (2 marks)
(b) Give one piece of evidence from the description that supports your answer. (2 marks)
(c) A student says, “The distribution is not symmetric because the two sides are not perfectly identical.” Do you agree? Explain. (2 marks)
(a)
1 mark for stating approximately symmetric or symmetric
1 mark for a correct shape description in context
(b)
1 mark for noting that the distribution decreases in a similar way on both sides
1 mark for noting that it extends about the same distance on both sides or has similar tail lengths
(c)
1 mark for disagreeing
1 mark for explaining that symmetry in real data is approximate and does not require perfect matching
FAQ
Yes. A single extreme value can lengthen one tail and make the graph appear skewed, especially in a small sample.
However, you should still look at the overall pattern. If one point is isolated but the rest of the data are fairly balanced, a careful description might mention both the apparent skewness and the unusual value.
There is no fixed visual cutoff in AP Statistics. The choice depends on whether one tail is clearly longer than the other.
If the difference is small, use cautious language such as:
slightly skewed right
slightly skewed left
approximately symmetric
That kind of wording is often better than making an overly strong claim.
Small samples are more affected by random variation. A few observations can make one side look longer even when the broader population is fairly balanced.
With larger samples, the overall shape is usually easier to judge because the graph is less jagged and the tails are more stable.
Yes. A variable can still look symmetric if the data are balanced around a center and not crowded near the boundary.
But natural limits often encourage skewness. For example, if many observations pile up near a maximum, the tail may extend more on the low side, creating left skew.
Yes. Display choices can affect how strongly skewness appears.
For example:
wider or narrower histogram bins can hide or emphasize a tail
a stretched or compressed scale can change the visual impression
small samples can look different across displays
If the shape is hard to judge, it helps to inspect the data with more than one reasonable graph.
