
AP Syllabus focus: 'Univariate graphs may be unimodal, bimodal, or approximately uniform, depending on the number and prominence of peaks.'
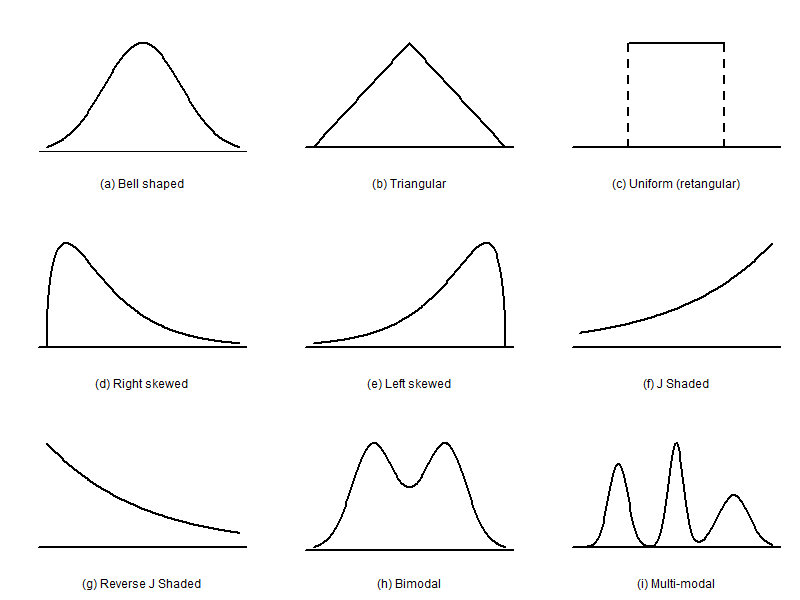
This diagram shows several classic distribution shapes, including unimodal (one peak), bimodal (two peaks), and uniform (flat/rectangular). Seeing the three shapes side-by-side highlights that “modality” is about the number of prominent peaks, while a uniform distribution has no clearly dominant high region. Source
When describing a quantitative distribution, statisticians pay close attention to where observations cluster. The number and strength of those clusters determine whether a graph appears unimodal, bimodal, or approximately uniform.
Recognizing peaks
A peak is a region in a graph where observations are concentrated more heavily than in nearby values. In AP Statistics, peaks are identified visually from displays such as histograms, dotplots, or stem-and-leaf plots. A peak is not just a single tall bar or one isolated stack of dots. It should stand out as a meaningful high region compared with the surrounding data.
Peak: A region of a graph where observations are concentrated more heavily than in nearby values.
When statisticians describe the modality of a distribution, they are describing how many clear peaks the graph has. The key word is clear. Small ups and downs caused by chance do not automatically create new modes. A distribution is classified by the number and prominence of its noticeable peaks.
What makes a peak noticeable?
A peak is more convincing when:
it extends across nearby values rather than appearing at only one isolated value
it rises above neighboring parts of the graph
it is separated enough from other high regions to look distinct
the pattern remains visible when the graph is viewed reasonably
This is why the specification emphasizes both the number of peaks and their prominence.
Unimodal distributions
A distribution is unimodal when it has one clear peak. Most of the observations gather around one main region, and frequencies generally decrease as you move away from that region. The peak does not have to be exactly in the center of the graph, and the two sides do not have to look identical. The essential feature is that one peak dominates the distribution.
When describing a unimodal graph, focus on the idea of a single prominent concentration of values. A graph should not be called bimodal just because it has a minor bump somewhere else. If the second bump is weak or uncertain, it is usually better to say the distribution is approximately unimodal.
Useful language includes:
one clear peak
a single prominent mound
most values cluster in one main region
approximately unimodal
Bimodal distributions
A distribution is bimodal when it has two clear peaks.
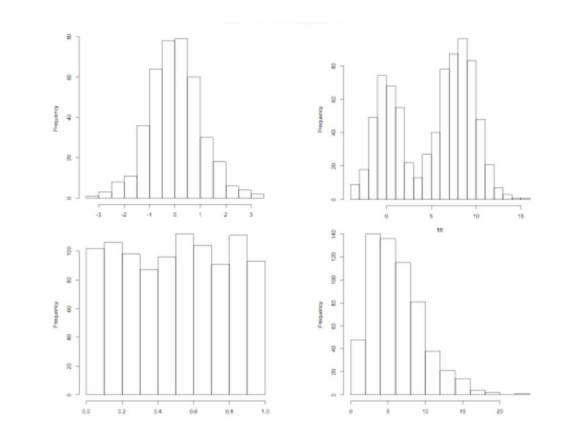
This page shows example histograms labeled by shape (including unimodal, bimodal, and uniform), illustrating what “one peak,” “two peaks,” and “no prominent peak” look like in a histogram. It is especially useful for connecting your written criteria (distinct high regions and a noticeable dip) to concrete histogram displays. Source
These peaks are usually separated by a lower-frequency region, although the separation does not have to be perfectly empty. What matters is that there are two distinct high areas in the graph.
Bimodality can be important because it often suggests that the data may combine observations from two different groups or two different underlying conditions. However, the graph alone does not prove why the two peaks appear. A good statistical description identifies the shape first and leaves explanation to the context and further investigation.
When deciding whether a graph is bimodal, ask:
Are there really two high regions?
Does each peak stand out from nearby values?
Is the dip between them noticeable enough to separate the peaks?
If the second peak is faint, the safest description is often possibly bimodal or showing two noticeable clusters, rather than making an overly strong claim.
Approximately uniform distributions
Some distributions do not have strong peaks at all. Instead, observations are spread fairly evenly across the range. In that case, the graph is described as approximately uniform.
Approximately uniform distribution: A distribution in which observations are spread fairly evenly across the range, with no prominent peak.
The word approximately matters. Real data rarely produce perfectly equal frequencies in every interval. A distribution can still be considered approximately uniform if the bars or stacks are reasonably similar in height and no region stands out as clearly higher than the rest.
In a uniform-looking distribution:
no single interval dominates
the graph has a relatively flat appearance
differences between nearby frequencies are modest
there is no obvious modal region
This shape contrasts with unimodal and bimodal distributions because those shapes are defined by prominent high points, while a uniform distribution is defined by the absence of a strong peak.
Why prominence matters
Not every irregularity should be treated as a mode. Real data contain randomness, so graphs often have small fluctuations. A good description separates signal from noise. Prominence helps with that judgment.
Several factors can affect whether peaks appear clear:
Sample size: Small samples can create accidental bumps.
Graph design: Different interval choices can make a graph look smoother or rougher.
Measurement practices: Rounded values can pile up and make certain locations look taller.
Because of these issues, AP Statistics descriptions should be cautious and evidence-based. If the graph does not strongly support two peaks, do not force a bimodal description.
Writing about modality in context
A strong written description of this feature should:
name the shape using words like unimodal, bimodal, or approximately uniform
mention the number of clear peaks
refer to the visible evidence in the graph
use cautious language when the pattern is not sharp
Good statistical wording is precise. For example, say a distribution is approximately uniform because the frequencies are fairly even across the range and no bar forms a prominent peak. Or say it is bimodal because the graph shows two distinct high regions separated by a lower region. The goal is to connect the label directly to what the display shows.
Practice Questions
A histogram of quiz scores has one clear high region near 8 points, and the bars become shorter on both sides with no other noticeable high region.
Describe the modality of the distribution and justify your answer. [2 marks]
1 mark: Correctly identifies the distribution as unimodal.
1 mark: Justifies with a statement such as one clear peak, one prominent high region, or no second noticeable peak.
A dotplot of travel times to school for 60 students shows one cluster around 10 to 15 minutes and another cluster around 30 to 35 minutes. There are only a few observations between 18 and 25 minutes.
(a) Describe the modality of the distribution. [1 mark]
(b) Explain what feature of the graph supports your answer. [2 marks]
(c) Give one plausible contextual reason why this shape might occur, and explain why the graph alone does not prove that reason. [2 marks]
(a)
1 mark: Identifies the distribution as bimodal.
(b)
1 mark: States that there are two clear peaks or two clusters.
1 mark: Notes the lower-frequency region between them that separates the peaks.
(c)
1 mark: Gives a plausible reason, such as students living at two typical distances from school or using two different transportation patterns.
1 mark: Explains that this is only a possible explanation and that the graph alone does not establish the cause.
FAQ
Yes. Histogram appearance depends on the interval widths and starting points.
Wide intervals can smooth the data and hide a second peak.
Narrow intervals can exaggerate random bumps and make extra peaks appear.
That is why modality should be judged carefully rather than mechanically. If the shape changes drastically when reasonable graph settings change, the evidence for a true second peak is weak.
Rounding pushes many values onto the same recorded numbers, which can create visible piles.
For example:
heights rounded to the nearest inch
times rounded to the nearest 5 minutes
ratings restricted to whole numbers
Those stacks can make a graph look more peaked than the underlying variable really is. When interpreting modality, it helps to know how the data were recorded.
No. Exact uniformity is unusual because real data vary from sample to sample.
What is more common is an approximately uniform pattern, where:
frequencies are fairly similar across the range
no interval is clearly dominant
the graph looks fairly flat overall
So in practice, statisticians usually describe observed data as approximately uniform rather than perfectly uniform.
Use cautious language. If the second peak is not clearly prominent, stronger wording may overstate the evidence.
Good choices include:
approximately unimodal
possibly bimodal
showing two mild clusters
not strongly peaked
This kind of wording shows statistical judgment. It is better to describe what the graph clearly supports than to force a definite label.
Bimodal patterns often occur when one variable combines two different subpopulations.
Common situations include:
two age groups in the same sample
two product types mixed together
two behavior patterns, such as short and long commute groups
The two peaks reflect two typical value regions. This does not automatically tell you what the subgroups are, but it is often a clue that the data may not come from one homogeneous population.
