
AP Syllabus focus: 'The median is the middle ordered value. Quartiles mark the middle 50% of ordered values, and the pth percentile has p% of data at or below it.'
Median, quartiles, and percentiles summarize where observations fall in an ordered data set. They describe position rather than total amount, making them essential for interpreting relative standing.
Ordering Data Before Finding Position
Median, quartiles, and percentiles are positional summaries. They tell you where values lie in an ordered list rather than how large the values are overall.
Always arrange quantitative data from smallest to largest before identifying any of these measures.
Keep every observation in the list, even if values repeat.
Treat each observation as its own position in the ordered data set.
Because these measures depend on order, they cannot be found correctly from an unordered list. A value may look “central” at first glance, but only the ordered positions determine the median, quartiles, and percentiles.
When values repeat, those repeated observations still count separately. This matters because the middle position or percentile location may fall on one of those repeated values.
The Median
The median identifies the center of an ordered data set.
Median: The middle value in an ordered data set. If there are two middle values, the median is the average of those two values.
If the number of observations is odd, one observation is exactly in the middle. If the number of observations is even, there are two middle observations, so the median is found by averaging them.
The median divides the data into two halves:
about 50% of the observations are at or below the median
about 50% of the observations are at or above the median
This makes the median a useful measure of positional center. In context, it should always be reported with the variable and units, such as minutes, dollars, or inches. A complete statistical statement is not just a number; it describes what that number refers to.
Quartiles
Once the median has been identified, the ordered data can be separated into a lower part and an upper part. Quartiles describe positions within those parts.
Quartiles: Values that divide ordered data into four parts. marks the lower quarter, the median marks the middle, and marks the upper quarter.
The median is also called the second quartile, or . The first quartile is near the point below which about 25% of the observations lie. The third quartile is near the point below which about 75% of the observations lie.
A key idea is that the interval from to contains the middle 50% of the ordered data.
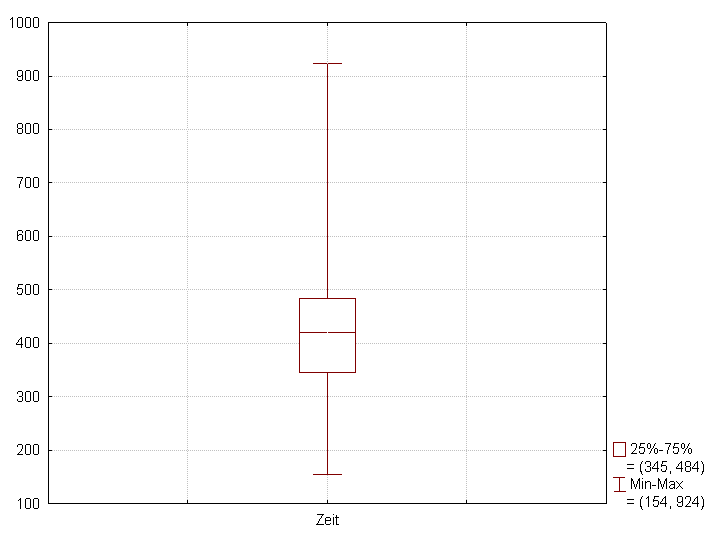
This box plot visualizes the five-number summary: the box spans from to (the interquartile range), and the line inside the box marks the median. The whiskers extend to the minimum and maximum values, showing how the middle 50% compares to the overall spread. Source
That is exactly why quartiles are useful: they show where the central half of the observations falls.
When the number of observations is odd, different textbooks, calculators, and software packages may use slightly different conventions for forming the lower and upper halves. On AP Statistics work, use the method required by your teacher, calculator, or the directions in the problem, and stay consistent.
Percentiles
Percentiles extend the same idea of ordered position to one hundred parts.
Percentile: The th percentile is a value such that about of the observations are at or below that value.
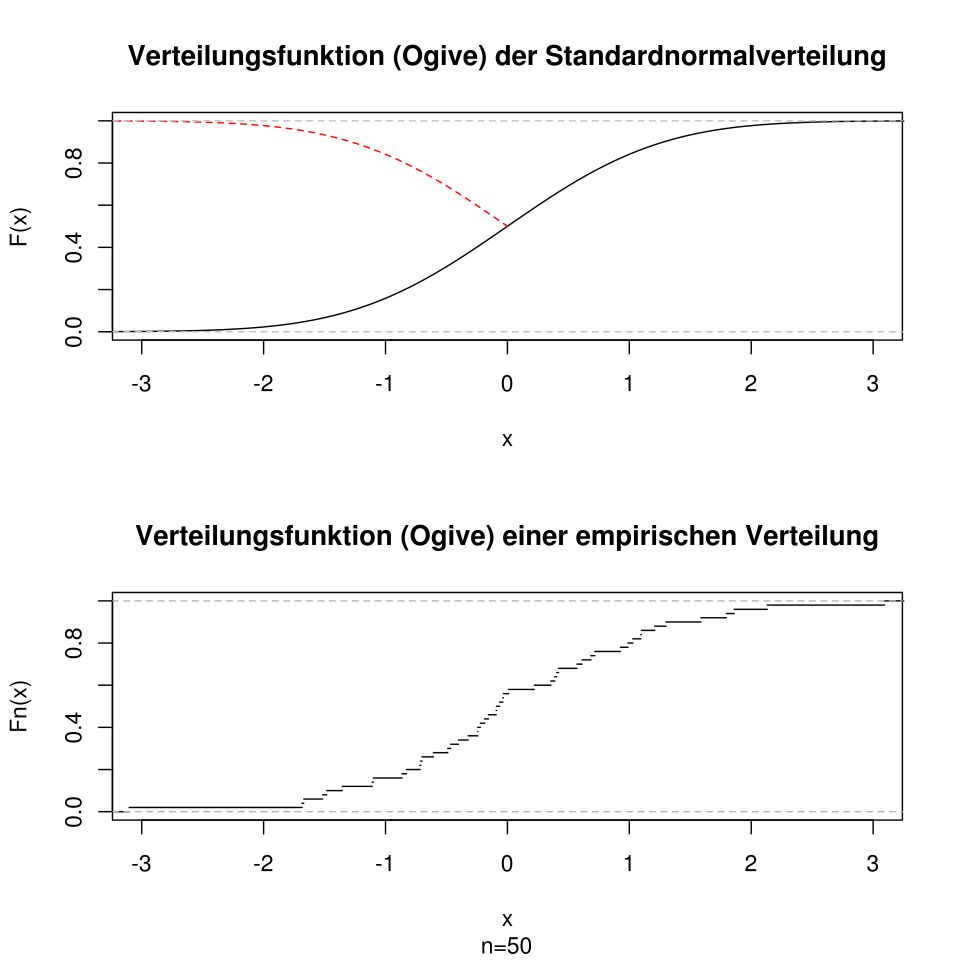
This ogive (empirical cumulative distribution function) shows cumulative proportion increasing from 0 to 1 as you move right along the data values. A percentile is read by choosing a cumulative level (e.g., 0.80) on the vertical axis and finding the corresponding x-value, matching the definition “at or below.” Source
A percentile gives relative standing within a data set. If a value is at the 80th percentile, then about 80% of the observations are at or below that value.
Important connections include:
the 50th percentile corresponds to the median
the 25th percentile corresponds to
the 75th percentile corresponds to
Percentiles are often misunderstood. A score at the 90th percentile does not mean 90% correct. It means the score is greater than or equal to most of the data, with about 90% of observations at or below it.
Percentiles are especially useful when the question asks about rank or standing within a group rather than about the center of the group.
Interpreting in Context
Median, quartiles, and percentiles should always be interpreted using the original variable and units. Good interpretation focuses on what portion of the data lies at or below a value.
Useful statistical language includes:
“the median value is ...”
“the middle 50% of observations fall between ... and ...”
“about of observations are at or below ...”
Be careful with direction. For percentiles, the key phrase is at or below. Saying that the 30th percentile means 30% are above reverses the meaning and is incorrect.
These summaries describe position in the ordered data. They do not explain causes, and they do not automatically describe the full distribution.
Common Mistakes to Avoid
forgetting to order the data before finding the middle
dropping repeated values instead of keeping every observation
using “average” when the question specifically asks for the median
confusing a percentile with a percent score
reporting , the median, or without units or context
assuming that exactly 25%, 50%, or 75% must be strictly below those values, even when repeated observations occur
Careful attention to ordered position and wording makes median, quartiles, and percentiles precise and meaningful.
Practice Questions
The ordered numbers of text messages sent in one day by 9 students are:
2, 4, 4, 5, 7, 8, 9, 11, 15
Find the median and interpret it in context.
1 mark for identifying the median as 7.
1 mark for a correct interpretation in context, such as: about half of the students sent 7 or fewer text messages, and about half sent 7 or more.
A teacher records the ordered quiz scores, in percent, for 12 students:
61, 66, 68, 70, 74, 76, 78, 81, 84, 86, 90, 95
(a) Find the median score.
(b) Find and .
(c) Interpret in context.
(d) State the score at the 75th percentile.
(e) Interpret the 75th percentile in context.
(a) 1 mark for median .
(b) 1 mark for and 1 mark for .
(c) 1 mark for a correct interpretation, such as: about 25% of the students scored 69 or lower.
(d) 1 mark for identifying the 75th percentile as 85.
(e) 1 mark for a correct interpretation, such as: about 75% of the students scored 85 or lower.
FAQ
Different technology may use different rules for locating positions in an ordered list.
Common differences include:
whether the overall median is included when splitting the data
whether a percentile is chosen from an existing data value or estimated between two values
whether positions are rounded or interpolated
That is why two correct tools can give slightly different answers. In AP Statistics, follow the method required by the problem or use one consistent technology method throughout your work.
Yes.
This happens when:
the median is the average of two middle values
a quartile is found by averaging two nearby values
software estimates a percentile between two observations
So these summaries are not always actual observed data values. They are location measures, and sometimes the best location is between two recorded observations.
A percentile rank tells where one observation stands relative to the rest of the data.
The value at a percentile is the cutoff point in the data set itself.
For example:
percentile rank asks, “What percent of scores are at or below this score?”
percentile value asks, “What score marks the 80th percentile?”
These are closely related, but they answer different questions.
Ties can make percentile language less exact because many observations may share the same value.
As a result:
one data value may correspond to several nearby percentile ranks
the jump from one percentile to another may happen without changing the data value
statements often use “about” rather than an exact proportion
That is why percentiles are usually interpreted with phrases like “at or below” and “about $p%$,” especially when many repeated values appear.
Only actual observed values should be used.
If some data are missing:
remove the missing entries from the ordered list
count only the non-missing observations when finding positions
do not replace a missing value with 0 unless 0 was actually observed
Missing values change the sample size, so they can also change the median, quartiles, and percentiles. Always check how many usable observations remain before calculating positional summaries.
