
AP Syllabus focus: 'Common measures of variability include range, interquartile range, and standard deviation. Range is maximum minus minimum; IQR is Q3 minus Q1.'
Measures of spread describe how much a quantitative data set varies. Two of the most basic are the range and the interquartile range, which capture overall spread and middle-half spread.
Why spread matters
A measure of spread tells how far data values extend or how tightly they are packed. Two distributions can have similar typical values but very different variability.
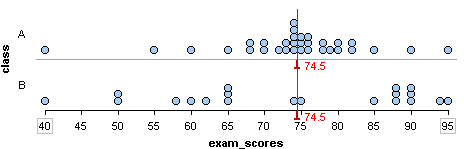
A two-class dotplot on a common axis illustrating that distributions can share a similar center (median marked on the plot) yet differ in how widely values are dispersed. Because individual observations are visible, students can see variability as horizontal distance on the scale and connect “spread” to how far points extend toward the minimum and maximum. Source
Because of that, reporting only a measure of center is often incomplete.
For this subsubtopic, the key idea is that range and IQR do not summarize the same part of a data set.
The range uses the smallest and largest observations.
The IQR uses the first and third quartiles.
The range describes overall spread.
The IQR describes the spread of the middle 50% of the data.
Range
A first measure of variability is the range.
Range: The difference between the largest and smallest observations in a quantitative data set.
The range gives the width of the data set from its lowest value to its highest value.
= overall spread in the original unit
= largest observed value
= smallest observed value
Because it depends only on the two endpoints, the range is quick to compute and easy to interpret. If the range is small, the values lie in a narrower interval. If the range is large, the values cover a wider interval. The result is always stated in the same units as the data because it is found by subtracting one data value from another.
The range is useful when you want a fast description of the full extent of a data set. However, it can change a lot if only the minimum or maximum changes, even when the rest of the observations stay almost the same.
Interquartile range
Another important measure of variability is the interquartile range, usually written as IQR. To find it, arrange the data in order and identify the two quartiles used in the calculation. The first quartile, , marks the lower quarter of the ordered data, and the third quartile, , marks the upper quarter.
Interquartile range: The difference between the third quartile and the first quartile in an ordered quantitative data set.
Unlike the range, the IQR focuses on the center of the distribution rather than the extreme ends.
= spread of the middle 50% of the data in the original unit
= third quartile
= first quartile
The IQR tells how wide the middle half of the data is. If the IQR is small, the central observations are packed closely together. If the IQR is large, the middle half is more spread out. Since it is based on quartiles, the IQR does not directly use the minimum or maximum value.
Finding the IQR from ordered data
The IQR cannot be found correctly unless the values are placed in increasing order first. A standard process is:
Order the data from smallest to largest.
Determine .
Determine .
Subtract from .
This process emphasizes that the IQR is not the distance from the median to either end. It is specifically the distance between the two quartiles that bound the middle half of the data.
When technology is used, always identify how the quartiles were obtained. Different software packages can use slightly different conventions for quartiles, especially in very small data sets. For AP Statistics, what matters most is using a consistent method and clearly communicating the result.
Interpreting range and IQR in context
Both measures describe variability, but they answer different questions.
Use the range to describe how far the data extend from minimum to maximum.
Use the IQR to describe how spread out the central portion of the data is.
Interpretations should always be written in context. A range measured in hours means the difference between the longest and shortest times observed. An IQR measured in centimeters means the width of the middle half of the measured lengths. Without context and units, the statistic is incomplete.
A larger numerical value does not mean the data are “better” or “worse.” It only means there is more spread according to that measure. Statistical interpretation depends on what quantity was measured and what level of variability is meaningful in the setting.
Choosing what each measure tells you
Range and IQR can suggest different features of the same distribution.
If only the smallest or largest value changes, the range changes immediately.
If the central portion changes, the IQR changes.
If the middle half stays similar, the IQR may stay similar even when the endpoints move.
If the endpoints stay fixed but the center becomes more dispersed, the range can stay the same while the IQR increases.
This is why statisticians often report more than one measure of spread. Each measure captures a different aspect of variability.
Common mistakes
Forgetting to order the data before finding quartiles.
Using the median instead of or in the IQR calculation.
Reporting the range or IQR with no units or no context.
Assuming two data sets with the same range must have the same overall distribution.
Treating the range and IQR as interchangeable when they summarize different parts of the data.
Practice Questions
A quantitative data set has a minimum value of 12 and a maximum value of 31. Find the range.
Uses or equivalent. (1)
States that the range is 19. (1)
The ordered weights, in ounces, of 11 packages are:
(a) Find and .
(b) Find the interquartile range.
(c) Find the range.
(d) Interpret the interquartile range in context.
Correctly identifies . (1)
Correctly identifies . (1)
Computes ounces. (1)
Computes range ounces. (1)
Gives a correct contextual interpretation, such as: the middle 50% of package weights span 6 ounces. (1)
FAQ
No. The range is the distance from the minimum to the maximum, so it covers the entire data set.
Since $Q_1$ and $Q_3$ must lie between the minimum and maximum, the distance $Q_3-Q_1$ cannot be greater than the full distance from minimum to maximum. In some data sets, both the range and the IQR can be 0, such as when every observation is the same.
Yes. Range and IQR are only two numerical summaries, so they do not capture every feature of a distribution.
Two data sets can share the same minimum, maximum, $Q_1$, and $Q_3$ but still differ in other ways, such as how values are arranged within the middle half or how observations are concentrated between the quartiles. That is why these statistics are useful summaries, but not complete descriptions.
The range can change immediately, because it depends only on the minimum and maximum values.
The IQR may or may not change. If the recording error affects only an extreme value and does not alter $Q_1$ or $Q_3$, the IQR stays the same. If the mistake is large enough to change the ordering of values near the quartiles, then the IQR can change too.
Repeated values do not automatically change either measure.
The range changes only if a repeated value becomes the new minimum or maximum.
The IQR changes only if the repeated values alter the locations of $Q_1$ or $Q_3$.
So a data set can gain many duplicate middle values and still keep the same range and IQR. What matters is whether the endpoints or quartile positions shift.
Some calculators and software programs compute quartiles by averaging nearby values or by using interpolation rules.
That can produce quartiles such as 10.5 or 16.5 even when every original observation is a whole number. Once the quartiles are decimals, the IQR can also be a decimal. This does not mean the calculator is wrong; it usually means it is using a different quartile convention.
