
AP Syllabus focus: 'A statistic is a numerical summary of sample data. The mean is the sum of all data values divided by the number of values.'
In AP Statistics, the mean is a foundational statistic because it turns an entire sample into one interpretable number. Understanding what it measures is essential before using more advanced summaries.
What a statistic means
A statistic is a number computed from a sample. Its purpose is to summarize information from many observations in a compact way. Instead of listing every data value one by one, statisticians often use one or more statistics to describe the sample efficiently. This makes data easier to communicate and interpret, especially when the sample is large.
Statistic: A numerical summary calculated from sample data.
A statistic is always tied to the sample from which it was calculated. If a different sample were collected, the value of the statistic could change. That is why a statistic should be described with its context, including what was measured and which sample was used.
Why statistics are used
Statistics help researchers:
reduce a large set of observations to a manageable form
communicate the main numerical features of a sample
identify what seems typical in the data
support claims that are based on the sample itself
A statistic is useful because it simplifies data, but it does not capture everything. A single numerical summary cannot show every detail of a sample.
The mean as an average
The mean is one of the most common statistics in AP Statistics. In everyday language, people often call it an average, but in statistics the mean has a very specific calculation rule. To find it, add all the data values and divide by the number of values. The mean is appropriate only for quantitative variables because the calculation requires meaningful numerical values.
Mean: The arithmetic average of a quantitative data set, found by adding all data values and dividing by the number of values.
Every observation contributes to the mean, so it reflects the entire sample rather than only one part of it.
= sample mean
= each data value in the sample
= number of data values in the sample
The symbol is read as “x-bar.” It represents the sample mean, which is a statistic because it is calculated from sample data. The mean is reported in the same units as the original variable. If the data are measured in hours, the mean is measured in hours. The mean does not have to be one of the observed values, and it does not have to be a whole number.
Interpreting the mean
The mean can be interpreted as the average amount per observation in the sample. It describes the overall level or typical amount suggested by the data when the total is spread evenly across all observations. This is why the mean is often useful in contexts such as average score, average height, average wait time, or average cost.
Another important idea is that the mean acts like a balance point of the data on a number line.
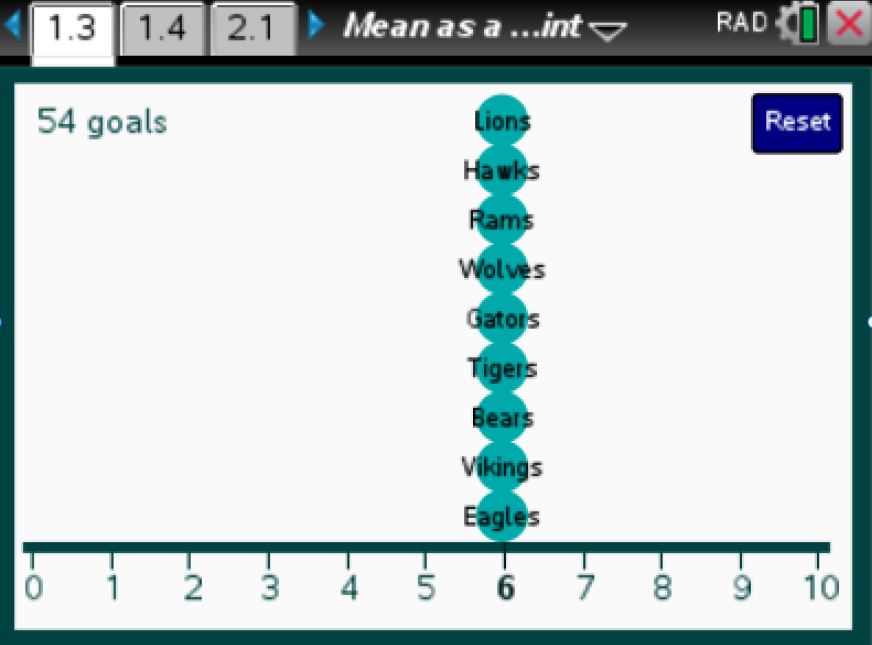
A dot plot on a number line with values positioned like weights, illustrating the mean as a balance point (fulcrum) where left- and right-side deviations counterbalance. This visual supports the idea that changing any one observation shifts the balance and can change the mean. Source
This interpretation shows why every value matters: changing any one observation changes the total, and changing the total can change the mean.
Because the mean depends on the total and the number of observations, it is closely connected to both. If the total increases while the sample size stays the same, the mean increases. If the sample size increases while the total stays fixed, the mean decreases.
Computing the mean correctly
Finding the mean is straightforward, but small mistakes can produce an incorrect result.
Confirm that the variable is quantitative.
Count all observations to determine .
Add every observed value.
Divide the total by .
Round only after the calculation is complete, if rounding is needed.
Repeated values must be counted as many times as they occur. Zero values must also be included. If data are summarized with frequencies, each value must contribute according to its frequency because the mean depends on the full total of all observations, not just on the list of distinct values.
Mean and total
The mean is especially helpful when the total matters. If you know the mean and the sample size, you can describe the total amount represented by the sample in words as “mean times number of observations.” This connection makes the mean valuable in settings where the data represent accumulated amounts, such as total minutes spent, total dollars earned, or total points scored.
The mean is therefore more than just a calculation rule. It is a way of linking the individual observations to the total amount in the sample.
Common mistakes with the mean
Students often make errors with the mean by confusing the idea of “average” with a less precise everyday meaning.
Common mistakes include:
calculating a mean for category labels, such as ID numbers or coded responses
forgetting to include zeros or repeated observations
dividing by the number of different values instead of the sample size
rounding intermediate values too early
reporting the mean without units
giving the mean without explaining what group or sample it describes
A correct mean should always be both numerically accurate and clearly interpreted as a statistic from sample data.
Practice Questions
A random sample of 25 college students is taken, and the mean number of hours they studied last week is reported as 11.8 hours.
State what the value 11.8 means, and explain why it is called a statistic.
1 mark for stating that 11.8 is the average number of hours studied by the 25 sampled college students last week.
1 mark for explaining that it is a numerical summary calculated from sample data.
A sample of eight delivery times, in minutes, is: 12, 15, 15, 18, 20, 22, 24, 34
(a) Calculate the sample mean.
(b) Interpret the mean in context.
(c) A ninth delivery time of 40 minutes is added to the sample. Find the new mean.
(d) Explain why the mean changed.
(a)
1 mark for finding the total as 160.
1 mark for calculating the mean as minutes.
(b)
1 mark for stating that the average delivery time in this sample is 20 minutes.
(c)
1 mark for updating the total to 200.
1 mark for calculating the new mean as minutes.
(d)
1 mark for explaining that the mean changed because it uses every value in the sample, and adding 40 increased both the total and the average.
FAQ
A weighted mean is used when some observations should count more than others.
Common cases include:
course grades with different category weights
GPA calculations where courses have different credit values
combining subgroup means when subgroup sizes differ
An ordinary mean treats every observation equally. A weighted mean does not.
Yes, but it is usually an estimate rather than an exact value.
If data are grouped into intervals, statisticians often use class midpoints with frequencies to approximate the mean. This works best when the intervals are narrow and the data are fairly evenly spread within each interval.
The result is useful, but it may not match the exact mean from the raw data.
This usually happens because of rounding or storage differences.
One calculator may:
keep more decimal places during intermediate steps
round displayed values before using them again
treat entered data as exact or rounded numbers
For accurate results, keep full precision as long as possible and round only at the end.
A trimmed mean is found after removing a small percentage of the lowest and highest values, then averaging what remains.
Reports sometimes use it to reduce the impact of unusually extreme observations. For example, a 10% trimmed mean removes the lowest 10% and highest 10% of values before calculating the average.
It is still a type of mean, but it is not the ordinary arithmetic mean used by default in AP Statistics.
Different random samples usually contain different observations, so their totals and averages can differ.
This happens even when the samples come from the same population. The change is a normal result of sampling variability, not necessarily a mistake.
Larger, well-designed samples often produce means that are more stable, but no sample mean is guaranteed to be exactly the same as another.
