
AP Syllabus focus: 'Changing measurement units affects calculated statistics. Outliers may be identified using 1.5 times the IQR or at least 2 standard deviations from the mean.'
This topic emphasizes two practical ideas: converting units changes numerical summaries in predictable ways, and unusually large or small observations should be identified with a stated statistical rule.
How unit changes affect statistics
A change of units happens when every observation is converted by the same rule, such as inches to centimeters or pounds to kilograms. In AP Statistics, the key question is not just whether the numbers change, but which statistics change and how.
Shifting and rescaling data
When the same constant is added to or subtracted from every value, measures of center move by that constant. The mean, median, and quartiles all shift, because the whole distribution is translated left or right. However, measures of spread do not change under a pure shift. The range, IQR, and standard deviation stay the same because the distances between observations are unchanged.
When every value is multiplied or divided by the same positive constant, both center and spread are rescaled. The mean, median, quartiles, range, IQR, and standard deviation are all multiplied or divided by that factor. Because variance is based on squared distances, it changes by the square of the scale factor. A unit conversion like inches to centimeters is this kind of change.
Some conversions use both operations. For example, a temperature conversion can multiply and then add. In that case, the change in center comes from both steps, while the change in spread comes only from the multiplication step. The overall shape of the distribution and the order of the data values stay the same after a consistent unit conversion.
This matters because numerical summaries must always be reported with the correct units. A standard deviation measured in centimeters is not numerically equal to a standard deviation measured in meters, even though both describe the same data set.
Detecting outliers
An outlier is a value that stands unusually far from the rest of the observations.
Outlier: A data value that is unusually small or unusually large relative to the rest of a data set.
You should not label a value as an outlier just because it “looks far away.” In AP Statistics, you are expected to support the claim with a clear rule and appropriate numerical evidence.
The rule
The interquartile range, or IQR, is the distance from to , so . The rule creates two cutoffs, sometimes called fences. Values beyond those cutoffs are flagged as outliers.
= first quartile
= third quartile
= interquartile range
This rule is often preferred when the distribution is skewed or already contains extreme values, because quartiles are not pulled strongly by unusually large or small observations. To use the rule correctly, find , , and the , calculate the lower and upper fences, and then compare each data value with those boundaries. Any observation below the lower fence or above the upper fence is identified as an outlier.
The standard deviation rule
Another possible rule is to flag observations that are at least 2 standard deviations from the mean.
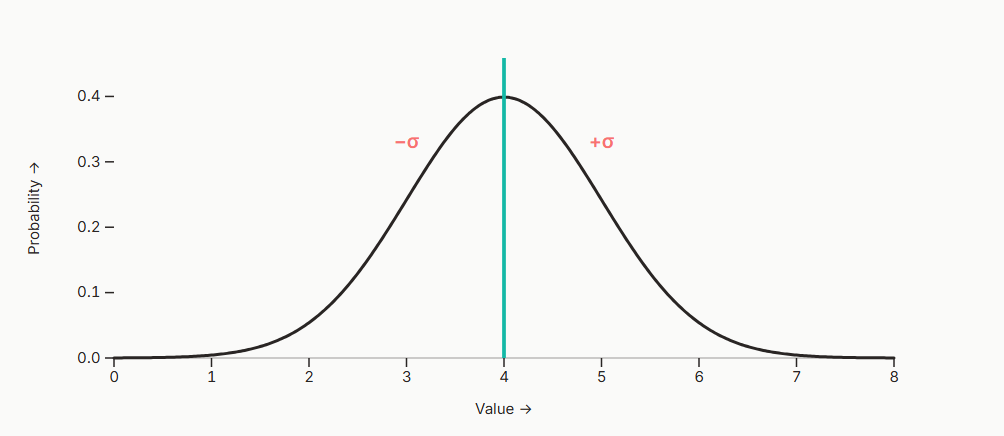
A normal curve diagram marks positions relative to the center using standard deviations, with labeled reference points at and . This helps interpret rules like as fixed “distance-from-the-mean” cutoffs measured in standard deviation units, which is most appropriate when the distribution is roughly symmetric. Source
This creates a lower cutoff and an upper cutoff centered at the sample mean.
= sample mean
= sample standard deviation
This method depends on the mean and standard deviation, so its cutoffs can be influenced by the very outliers you are trying to detect. For that reason, it is usually more appropriate when the distribution is roughly symmetric and not strongly affected by extreme values. If an observation is less than the lower cutoff or greater than the upper cutoff, it is flagged by this rule.
Linking unit changes and outlier detection
A consistent unit conversion changes the numerical values of the outlier boundaries, but it does not change which observations are unusually far from the rest. If every measurement is converted from one unit to another, the same cases remain outliers because the data values and the cutoffs are transformed together.
For example, if a data set is converted from inches to centimeters, all values are multiplied by the same positive constant. The mean, quartiles, IQR, and standard deviation all change to the new unit. The lower and upper fences, or the cutoffs, also change to that same unit. As a result, an observation that was beyond a cutoff before the conversion remains beyond the corresponding cutoff after the conversion.
The main danger is mixing units or forgetting to update the units when reporting a statistic. An outlier rule only makes sense if every value in the data set is expressed in the same measurement system.
What to write on an AP response
When you are asked about unit changes or outliers, strong responses usually do the following:
Name the rule being used, such as the rule or the standard deviation rule.
State the relevant cutoffs before deciding whether a value is an outlier.
Compare the observation to the cutoff numerically, not just visually.
Include units when reporting transformed statistics.
Describe the effect of the conversion on the statistic, rather than saying only that it “changes.”
Practice Questions
A data set has and . One observation is . Use the rule to determine whether is an outlier.
1 mark for finding and the upper fence
1 mark for stating that , so is an outlier
A sample of battery lifetimes has mean hours and standard deviation hours. One battery lasted hours.
(a) Use the standard deviation rule to determine whether hours should be flagged as a potential outlier.
(b) The data are converted from hours to minutes. State the new mean and the new standard deviation.
(c) Would the same battery still be flagged after the conversion? Explain briefly.
1 mark for calculating the upper cutoff as hours
1 mark for concluding that hours is a potential outlier because it is greater than
1 mark for giving the new mean as minutes
1 mark for giving the new standard deviation as minutes
1 mark for explaining that the same battery is still flagged because converting units multiplies every value and every cutoff by the same factor
FAQ
It is a convention that gives a useful balance between being too sensitive and not sensitive enough.
For many distributions, $1.5 \times IQR$ flags values that are clearly unusual without labeling too many ordinary observations as outliers. It is not a law of nature, but it is a widely accepted screening rule.
Only remove an outlier when you have a strong, defensible reason.
Common reasons include:
a recording mistake
a measurement error
a value from a different population than the one being studied
If the value is real and relevant, it usually should stay in the data set, even if it is unusual.
Rounding can matter when a value is very close to a cutoff.
If both the observation and the outlier boundary are rounded too early, a value near the line might appear to switch from “not outlier” to “outlier,” or the reverse. A safer approach is to keep full precision during the conversion and outlier check, then round only the final reported results.
Convert all observations to one common unit before computing any summary statistic or checking for outliers.
If units are mixed, the mean, standard deviation, quartiles, and outlier cutoffs become meaningless. When possible:
identify the original unit for each value
convert carefully using one rule
then recalculate the summaries from the corrected data set
It may suggest that the issue is not just a few unusual values.
Possible explanations include:
the distribution is strongly skewed
the data contain more than one group
the units or entries were recorded incorrectly
the chosen outlier rule does not match the structure of the data very well
In that case, the data set deserves closer investigation rather than automatic deletion of values.
