
AP Syllabus focus: 'Standard deviation measures variability in a quantitative distribution. For a sample it is denoted by s, and s squared is the sample variance.'
Standard deviation and variance summarize how spread out quantitative data are. These measures use distances from the mean and help describe whether observations are tightly grouped or widely dispersed.
What Standard Deviation Measures
The standard deviation describes how much the values in a quantitative data set tend to vary around the mean. It does not describe the center itself. Instead, it summarizes whether observations are packed closely near the mean or spread farther away. A small standard deviation indicates relatively little variation, while a large standard deviation indicates greater variation.
Standard deviation: A measure of variability that describes how far observations tend to be from the mean of a quantitative data set.
In AP Statistics, standard deviation is usually discussed for a sample, so the symbol is . The measure is built from each observation’s deviation from the mean, found by subtracting the sample mean from that observation. Because every data value contributes, standard deviation reflects overall spread across the entire sample rather than only the middle or the extremes.
= sample standard deviation
= an individual data value
= sample mean
= number of observations in the sample
This formula shows that standard deviation is based on distances from the sample mean. Although it is not exactly the average distance from the mean, it is often interpreted as a kind of typical distance. That interpretation is useful when thinking about how tightly or loosely the data cluster around the mean.
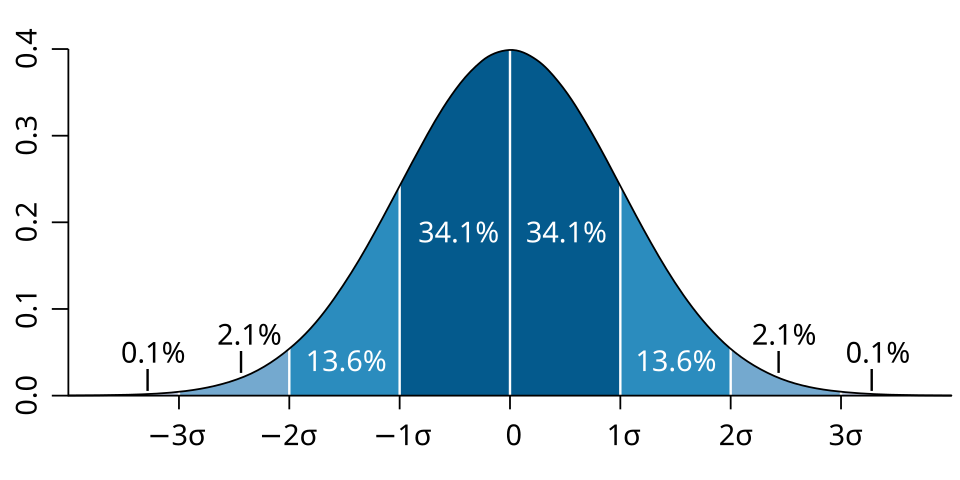
Normal curve segmented into successive 1-standard-deviation intervals from the mean, with the approximate proportion of area in each band labeled. This makes the idea of “typical distance from the mean” concrete by showing how probability mass concentrates near the center and thins out in the tails. Source
Why the Formula Is Built This Way
Each part of the standard deviation formula has a purpose.
First, the mean is subtracted from every observation, producing deviations.
Next, the deviations are squared. This prevents positive and negative deviations from canceling and gives more weight to observations that are far from the mean.
Then the squared deviations are added and divided by in the sample formula.
Finally, the square root is taken so the result is expressed in the original units of the variable.
Because of the square root, standard deviation is easier to interpret than variance when describing data in context.
If a variable is measured in inches, minutes, or dollars, the standard deviation is also in inches, minutes, or dollars.
A few important facts follow directly from the formula:
Standard deviation can never be negative.
Standard deviation equals only when all observations are identical.
Larger values of mean greater spread about the mean.
Unusually distant observations can have a strong effect because deviations are squared.
Variance and Its Role
The variance is closely related to standard deviation and is often used alongside it.
Variance: A measure of variability equal to the average squared deviation from the mean, using the sample formula when working with sample data.
For a sample, the variance is written as . Since standard deviation is the square root of variance, the two measures contain the same information about spread, but in different forms. Standard deviation is usually easier to interpret, while variance is often more convenient in formulas and later statistical methods.
= sample variance
= an individual data value
= sample mean
= number of observations in the sample
Variance is measured in squared units, which makes it less intuitive in context. If the data are measured in centimeters, then the variance is in square centimeters. That is why descriptions of variability in reports and interpretations usually emphasize standard deviation rather than variance, even though the variance is mathematically fundamental.
Interpreting Standard Deviation and Variance in Context
When you interpret standard deviation, always connect it to the variable and its units. A statement about standard deviation should describe the amount of variation around the mean, not the value of the mean itself. Likewise, a variance should be identified as a measure of spread and recognized as being in squared units.
Comparisons using standard deviation or variance are meaningful only when the values come from the same quantitative variable or from data measured in the same units. A standard deviation of minutes and a standard deviation of inches represent very different kinds of variability, even though the number is the same.
When reading computer output or calculator results, remember these common relationships:
refers to sample standard deviation.
refers to sample variance.
A larger always corresponds to a larger , since one is the square of the other.
Because squaring changes scale, differences in variance can appear much larger numerically than differences in standard deviation.
These measures are most useful when they are interpreted as part of a quantitative distribution, with clear attention to the context, the units, and how spread out the observations are around the sample mean.
Practice Questions
A sample of reaction times has variance . State the sample standard deviation and briefly interpret it.
1 mark for stating that .
1 mark for explaining that the standard deviation measures the spread of reaction times around the mean in the original units.
Two samples record daily water use, in gallons, for households.
Sample A: mean ,
Sample B: mean ,
(a) Which sample has greater variability? Explain.
(b) Interpret in context.
(c) Find the sample variance for each sample.
(d) Explain why standard deviation is usually easier to interpret than variance for this variable.
1 mark for identifying Sample B as having greater variability.
1 mark for justifying that choice by connecting a larger standard deviation to more spread around the mean.
1 mark for interpreting as the typical distance of household water use from the mean of 48 gallons.
1 mark for giving the variances: Sample A , Sample B .
1 mark for explaining that standard deviation is in gallons, while variance is in squared gallons.
FAQ
When the sample mean is computed from the same data, the deviations are not all free to vary independently. That makes a direct division by $n$ tend to underestimate variability.
Using $n-1$ corrects that tendency and gives a better estimate of population variance from sample data. This adjustment is often called Bessel’s correction.
Many calculators use $S_x$ for the sample standard deviation and $\sigma_x$ for the population standard deviation. Some also report variance separately.
For AP Statistics, use the sample version when the data come from a sample. If a calculator gives both, check which symbol matches the situation before interpreting the result.
Standard deviation comes from several operations: finding the mean, subtracting, squaring, averaging, and taking a square root. Those steps rarely produce a whole number.
So a decimal standard deviation is completely normal, even if the original observations are all integers. The decimal reflects the computation, not an error.
Yes. Standard deviation compresses variability into one number, so different distributions can share the same value of $s$.
For example, one data set might be symmetric while another is strongly clustered or has separate groups. That is why a numerical summary and a graph are often both useful.
Variance works especially well in algebra because squared quantities combine neatly in many formulas. This makes variance central in methods such as regression, analysis of variance, and probability models.
Standard deviation is usually preferred for interpretation because it returns to the original units. In practice, statisticians often calculate with variance and explain results with standard deviation.
