
AP Syllabus focus:
‘Analysis of nonresponse bias, which occurs when individuals selected for a sample are unreachable or refuse to participate, potentially differing significantly from those who do respond. Strategies for reducing nonresponse bias and its implications on sample representativeness will be discussed.’
Nonresponse bias threatens the accuracy of statistical findings by allowing systematic differences between respondents and nonrespondents to distort conclusions, making representative data collection essential for trustworthy inference.
Understanding Nonresponse Bias
Nonresponse bias is a form of systematic error that occurs when individuals chosen for a sample do not participate, and their absence is related to the variables of interest.

Symbolic illustration of an online survey instrument, highlighting how surveys rely on participant responses and are therefore vulnerable to nonresponse bias. The visual emphasizes the role of questionnaires in data collection. The icon does not depict specific survey content. Source.
Nonresponse Bias: A sampling bias that arises when selected individuals do not provide data and their likelihood of responding is related to the study variables.
When nonresponse bias is present, estimates such as means, proportions, or correlations may be distorted because the responding group does not accurately reflect the full population. This outcome weakens generalizability and reduces the validity of any inference drawn from the sample.
Why Nonresponse Bias Occurs
Nonresponse can happen for many reasons, and its impact is magnified when the reasons are systematically linked to the study topic.

Depiction of a completed survey checklist representing respondents who provide usable data. The image reinforces the contrast between responders and nonresponders in studies. The illustration is symbolic rather than specific to any study instrument. Source.
Common sources include:
Inaccessibility, such as outdated contact information or limited communication channels.
Refusal to participate, often influenced by survey length, sensitivity of questions, or lack of interest.
Differential motivation, where individuals with strong opinions are more likely to respond than those who feel neutral.
Survey fatigue, in which respondents ignore or abandon surveys because they are overwhelmed by frequent requests.
These mechanisms create patterns where certain groups—such as younger individuals, busier individuals, or people with specific attitudes—respond at lower rates, producing biased results.
Distinguishing Unit Nonresponse and Item Nonresponse
Two distinct forms of nonresponse can influence data quality:
Unit nonresponse: The entire selected individual fails to participate.
Item nonresponse: The individual participates but skips particular questions.
Unit Nonresponse: When a selected participant does not provide any data.
A sentence must be included here to separate definition blocks, clarifying that unit nonresponse is particularly harmful because it removes entire observations, altering the sample composition.
Item Nonresponse: When a participant provides some information but leaves specific questions unanswered.
While item nonresponse is also problematic, unit nonresponse poses a greater threat to representativeness because entire individuals’ data are missing.
Effects on Representativeness and Inference
Nonresponse bias directly undermines the ability to generalize from a sample to a population.
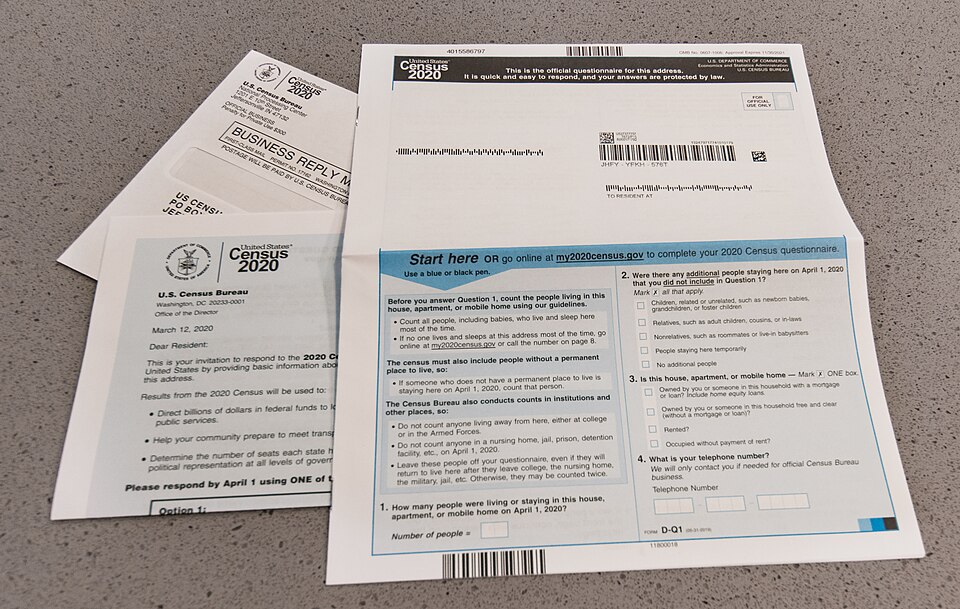
Real-world example of a mailed census questionnaire used to collect nationwide demographic data. Nonresponse to such large-scale surveys can severely threaten representativeness. The U.S.-specific content exceeds syllabus scope but effectively illustrates how survey instruments operate in practice. Source.
In AP Statistics, valid inference relies on random sampling, which assumes that every sampled individual has an equal chance of responding. When response probabilities differ, the independence and randomness assumptions weaken, jeopardizing inference.
Key impacts include:
Distorted estimates, such as overstating or understating a characteristic if nonrespondents hold different views or behaviors.
Reduced external validity, because the sample no longer mirrors the population.
Greater sampling variability, since fewer usable responses shrink the effective sample size.
Threats to causal interpretation, in surveys or observational studies where missing groups correlate with explanatory variables.
Strategies to Reduce Nonresponse Bias
High-quality statistical studies incorporate deliberate design choices to minimize nonresponse. Effective strategies include:
Multiple contact attempts, such as follow-up calls, reminders, or re-sending surveys to unreachable individuals.
Varied communication modes, including email, phone, mail, or in-person invitations, which increase the chance of reaching diverse participants.
Incentives, which boost motivation to respond without altering the substantive content of responses.
Clear, concise survey design, reducing the burden on respondents and lowering refusal rates.
Assurance of confidentiality, increasing comfort with sensitive topics and improving honesty and participation.
These approaches aim not only to increase the overall response rate but also to reach underrepresented groups, thereby improving representativeness.
Adjusting for Nonresponse in Analysis
Even with careful planning, some nonresponse is inevitable. Statistical adjustments may help correct for its effects:
Weighting, in which responses from underrepresented groups receive greater weight to approximate population proportions.
Imputation, where missing values are estimated based on available data, especially useful for item nonresponse.
Response propensity modeling, which estimates the likelihood of response and adjusts estimates accordingly.
These techniques attempt to restore population alignment, though they cannot fully replace high-quality data collection.
Identifying and Monitoring Nonresponse Bias
Researchers must regularly evaluate whether nonresponse threatens the validity of their study. Useful practices include:
Comparing early and late respondents.
Checking demographic distributions against known population benchmarks.
Tracking response rates across subgroups such as age, gender, or region.
Such monitoring ensures awareness of emerging biases and encourages corrective action.
Role of Nonresponse Bias in AP Statistics
Understanding nonresponse bias is essential for evaluating survey reliability. Because AP Statistics emphasizes sound data collection and inference, students must recognize how nonresponse disrupts representativeness and learn strategies that safeguard the integrity of sample-based conclusions.
FAQ
A low response rate does not automatically produce nonresponse bias. Bias occurs only when nonrespondents differ meaningfully from respondents in ways relevant to the study.
A study can have a low response rate with minimal bias if the missing group is similar to those who responded. Conversely, even a moderate response rate can produce substantial bias if the missing group is systematically different.
Yes. Random sampling affects who is selected, not who actually participates. Nonresponse bias arises after selection, during the data collection stage.
Even if sampling is perfectly random, systematic differences between responders and nonresponders can distort the results and limit representativeness.
Questions that are sensitive, complex, or require additional effort from the respondent tend to have higher rates of item nonresponse.
Common triggers include:
• Income, personal behaviour, or health-related topics
• Long or multi-step questions
• Ambiguous wording that confuses respondents
Researchers can monitor response patterns throughout the data collection period.
Useful approaches include:
• Comparing early versus late respondents
• Tracking response rates across demographic subgroups
• Checking if reminders attract a different type of respondent
These checks help identify emerging biases while adjustments are still possible.
Weighting adjusts responses to better match population characteristics, but it relies on accurate information about both respondents and nonrespondents.
If important differences between the two groups are unknown or unmeasured, weighting cannot fully correct the bias. It also increases variance, making estimates less precise.
Practice Questions
Question 1 (1–3 marks)
A school emails a survey to all students asking about their daily screen time. Only 28% of students respond.
Explain why the results of this survey may be affected by nonresponse bias.
Question 1
1 mark: Identifies nonresponse bias as a concern.
1 mark: States that non-responding students may differ systematically from those who respond.
1 mark: Explains a reasonable direction or consequence (e.g., students with higher screen time being less likely to respond, causing underestimation).
Maximum: 3 marks.
Question 2 (4–6 marks)
A local council wants to understand residents’ satisfaction with public transport. They randomly select 800 households and mail each a questionnaire. Only 320 households return the survey. Further investigation shows that households located closer to major bus routes were far more likely to respond than those in outlying areas.
(a) Identify the type of bias present and explain why it occurs.
(b) Describe two strategies the council could use in future to reduce this form of bias.
(c) Explain how this bias could affect the conclusions drawn about residents’ satisfaction.
Question 2
(a)
1 mark: Correctly identifies nonresponse bias.
1 mark: Explains that households nearer bus routes were more likely to respond, meaning respondents differ systematically from nonrespondents.
(b)
Up to 2 marks: Any two valid strategies, 1 mark each.
Examples:
• Sending reminders or follow-up contacts.
• Providing multiple response options (online, mail, phone).
• Offering incentives to participate.
• Shortening or simplifying the questionnaire.
(c)
Up to 2 marks: Explanation of impact on conclusions.
Examples:
• Satisfaction may be overestimated because residents with better access to transport are more likely to respond.
• Results would not generalise well to the entire council population.
Maximum: 6 marks.
