
AP Syllabus focus:
‘Investigation of response bias, including the influence of question wording, survey instrument design, and self-reporting on the accuracy of data collected. This section will offer insights into identifying and correcting for response bias in survey questions and data collection methods.’
Understanding response bias is essential because inaccurate answers distort collected data. This topic explores how survey design, interviewer behavior, and respondent tendencies compromise reliability and how researchers can reduce such bias.
Response Bias in Statistical Studies
What Is Response Bias?
Response bias refers to any systematic pattern in which respondents provide inaccurate or false answers, reducing the truthfulness and usefulness of collected data. Because surveys often rely on self-reported information, even small influences—such as question wording or social pressure—can alter responses in predictable ways and compromise the validity of conclusions.
This icon depicts a digital questionnaire, representing online survey environments where self-reported answers are collected. It emphasizes that response bias can occur in any self-report setting. The graphic is stylized and does not include technical content beyond illustrating survey contexts relevant to response bias. Source.
Response Bias: A systematic tendency for participants in a sample to give inaccurate or misleading responses due to survey design, interviewer influence, or respondent-related factors.
Researchers studying populations rely on truthful and consistent answers, so recognizing sources of response bias is a necessary part of planning high-quality data collection methods.
Key Sources of Response Bias
Question Wording Effects
The phrasing of a question can unintentionally guide respondents toward particular answers. Leading questions, loaded language, and double-barreled questions create unequal response tendencies.
Common wording issues include:
Emotionally charged or biased terms that make one answer appear more acceptable.
Suggestive phrasing that implies the “correct” choice.
Overly complex questions that confuse respondents.
Questions containing multiple ideas, forcing a single answer to represent several unrelated opinions.
When question wording alters responses, the resulting data do not reflect true attitudes or behaviors, limiting the validity of any statistical inference.
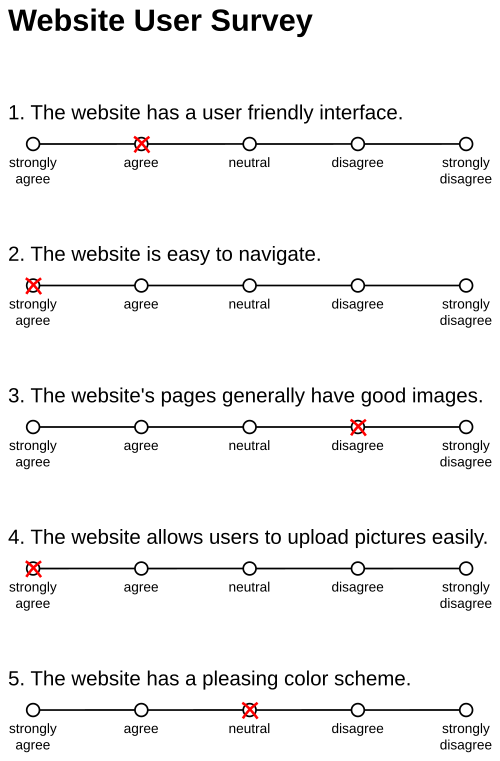
This figure presents a 5-point Likert scale with statements and labeled response options. It illustrates how question wording and scale structure influence self-reported attitudes. The specific content about Wikipedia goes beyond the syllabus, but the scale format directly supports understanding of response bias. Source.
Survey Instrument Design Issues
The survey instrument, meaning the structure and layout of the questionnaire, can also generate response bias.
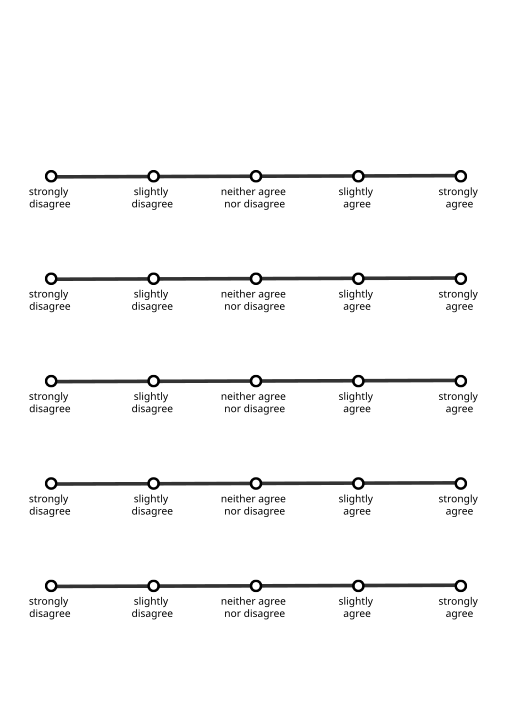
This blank 5-item Likert questionnaire illustrates how layout, response options, and structure shape the way respondents choose answers. It highlights the design elements that can minimize or exacerbate response bias. The form contains no topic-specific content, keeping the focus on survey structure. Source.
Important instrument-related sources include:
Order effects, where earlier questions influence answers to later ones.
Response option formats, such as unbalanced scales or limited answer choices.
Visual layout problems, like cluttered formats that encourage careless responses.
Mode of administration, including phone, online, or face-to-face surveys, which can affect comfort levels and honesty.
Poorly designed instruments systematically shape how respondents interpret questions and select answers, producing biased data.
Self-Reporting and Social Pressures
Respondents’ personal characteristics and motivations often contribute directly to response bias. In some contexts, individuals may alter answers to appear more favorable, more knowledgeable, or more socially appropriate.
Major respondent-driven sources include:
Social desirability bias, where individuals avoid socially disapproved responses.
Recall bias, caused by imperfect memory or difficulty estimating past behavior.
Acquiescence bias, the tendency to agree with statements regardless of true belief.
Fear of judgment, especially in sensitive topics involving health, income, or illegal behavior.
These patterns make responses systematically inaccurate, narrowing the survey’s ability to uncover truthful population characteristics.
Identifying Response Bias
Indicators of Response Bias
Researchers must look for signs that survey answers are systematically skewed. Common indicators include:
Strongly unbalanced responses inconsistent with expected population behavior
Sudden shifts in distribution after minor phrasing changes
Excessively high agreement rates in attitudinal surveys
Inconsistencies between self-reported measures and external records
These observations help analysts flag potential bias and adjust their interpretation of results.
Analytical Strategies for Detection
Although AP Statistics emphasizes conceptual understanding, students should recognize how analysts might identify bias:
Comparing responses across question versions to reveal wording effects
Checking for internal consistency among related questions
Reviewing item nonresponse patterns, which may indicate respondent confusion
Assessing survey mode effects, noticing differences among online, phone, and in-person answers
Such strategies assist researchers in determining whether bias compromised survey accuracy.
Reducing and Correcting Response Bias
Improving Question Wording
Researchers can minimize wording-related bias by ensuring that questions are:
Neutral and free of judgmental phrasing
Short, clear, and limited to a single idea
Written at an appropriate reading level
Balanced so all response options appear equally acceptable
Good wording supports unbiased understanding, promoting more accurate self-reporting.
Enhancing Survey Instrument Design
Thoughtful questionnaire structure reduces confusion and helps ensure reliable answers. Effective strategies include:
Placing sensitive or complex questions later in the survey
Randomizing question order when appropriate
Balancing response scales with symmetrical positive and negative options
Using consistent formatting to guide respondents clearly
These practices minimize order effects and help respondents focus on each question independently.
Addressing Self-Reporting Issues
To reduce personal and social influences on responses, researchers may:
Guarantee confidentiality or anonymity
Use indirect questioning techniques for sensitive topics
Provide clearly defined time frames to improve recall accuracy
Offer nonjudgmental response options to lower social pressure
These approaches encourage honesty and reduce systematic misreporting.
The Importance of Controlling Response Bias
Impact on Statistical Analysis
Response bias affects every stage of statistical work:
It compromises data quality, weakening both descriptive and inferential analyses.
It can lead to misleading trends, where patterns reflect bias rather than true population behavior.
It undermines the accuracy of estimates, confidence intervals, and hypothesis tests derived from biased responses.
Because statistical conclusions rely heavily on truthful data, reducing response bias is essential for producing valid and reliable results that align with the AP Statistics emphasis on trustworthy data collection.
FAQ
Response bias occurs after individuals have already been selected for a study, arising from how they answer rather than who is chosen.
Sampling bias occurs before data collection begins, affecting which individuals enter the sample at all.
These biases are treated separately because even a perfectly random sample can still yield distorted data if respondents provide inaccurate or pressured answers.
Interviewers may unintentionally influence answers through tone of voice, facial expressions, or subtle approval cues.
Face-to-face surveys are particularly vulnerable because respondents may feel pressure to give socially acceptable or agreeable responses.
Training interviewers to maintain neutral delivery and expression helps limit these influences.
Memory limitations and difficulty estimating frequency can distort self-reported behaviour.
Common issues include:
• Telescoping, where events are remembered as more recent than they were.
• Rounding behaviour, such as giving estimates ending in zero or five.
• Overestimation of desirable behaviours and underestimation of undesirable ones.
Earlier questions can “prime” respondents by activating specific ideas or emotions that shape later answers.
For example, questions about personal health may cause respondents to report healthier habits on subsequent items.
Randomising question order or separating related themes can reduce these order effects.
Analysts look for patterns inconsistent with expected behaviour or external benchmarks.
Useful indicators include:
• Clustering of responses around socially approved answers.
• Unusually high agreement rates in attitude items.
• Contradictory responses between similar questions.
Comparing subgroups or survey modes can further reveal systematic distortions.
Practice Questions
Question 1 (1–3 marks)
A school wants to survey students about how often they revise for mathematics. The question written on the survey is:
“Do you agree that students should revise regularly to succeed in mathematics?”
Explain why this question is likely to generate response bias.
Question 1 (1–3 marks)
• 1 mark: Identifies that the question is leading or uses biased wording.
• 1 mark: Explains that the wording suggests the socially desirable or “correct” answer is to agree.
• 1 mark: States that this may pressure students to respond inaccurately, creating response bias.
Question 2 (4–6 marks)
A market research company conducts an online survey asking participants to report how many servings of fruit and vegetables they eat each day.
Participants must select one of the following options:
• 0–1 servings
• 2–3 servings
• 4–5 servings
• 6 or more servings
The company notices that most participants select 4–5 servings, which contradicts national health data indicating that the majority of the population eats fewer than 3 servings per day.
(a) Identify two different sources of response bias that could explain this result.
(b) For each source you identify, explain how it may have affected the responses.
(c) Suggest one change to the survey design that could reduce response bias.
Question 2 (4–6 marks)
(a) Identification of sources of response bias (up to 2 marks):
• 1 mark: Identifies social desirability bias (e.g., wanting to appear healthier).
• 1 mark: Identifies issues in survey instrument design (e.g., unbalanced or limited response options; online survey mode).
(b) Explanation (up to 3 marks):
• 1 mark: Explains how social desirability may lead participants to over-report healthy eating.
• 1 mark: Explains how limited response options may push respondents towards middle categories or overestimate intake.
• 1 mark: Explains how online surveys may encourage quick or careless responses due to lack of engagement.
(c) Improvement suggestion (1 mark):
• 1 mark: Provides a reasonable improvement such as using neutral wording, offering more precise or open-ended response categories, or ensuring anonymity is emphasised.
