
AP Syllabus focus:
‘Formal decision-making involves comparing the p-value to the significance level (α). If the p-value is less than or equal to α, reject the null hypothesis in favor of the alternative hypothesis. If the p-value is greater than α, fail to reject the null hypothesis.’
Making formal decisions using p-values provides a structured rule for determining whether sample evidence is strong enough to challenge the assumed truth of the null hypothesis. This subsubtopic explains how statisticians use the significance level and p-value to guide these decisions.
Formal Decision Rules in Hypothesis Testing
Formal decision-making in hypothesis testing is grounded in a comparison between the p-value and the significance level (α). The goal is to determine whether the observed data provide sufficient evidence to support the alternative hypothesis, which represents a meaningful claim or effect suggested by the research question. Because the p-value evaluates the compatibility of the sample data with the null hypothesis, it becomes a practical decision tool for judging whether that compatibility is too weak to maintain the assumption that the null hypothesis is true.
The Role of the Significance Level
The significance level α is a threshold that quantifies the risk of incorrectly rejecting a true null hypothesis. It is chosen before any data analysis to preserve objectivity in the decision-making process. Common values of α include 0.05, 0.01, and 0.10, each reflecting different tolerances for uncertainty.
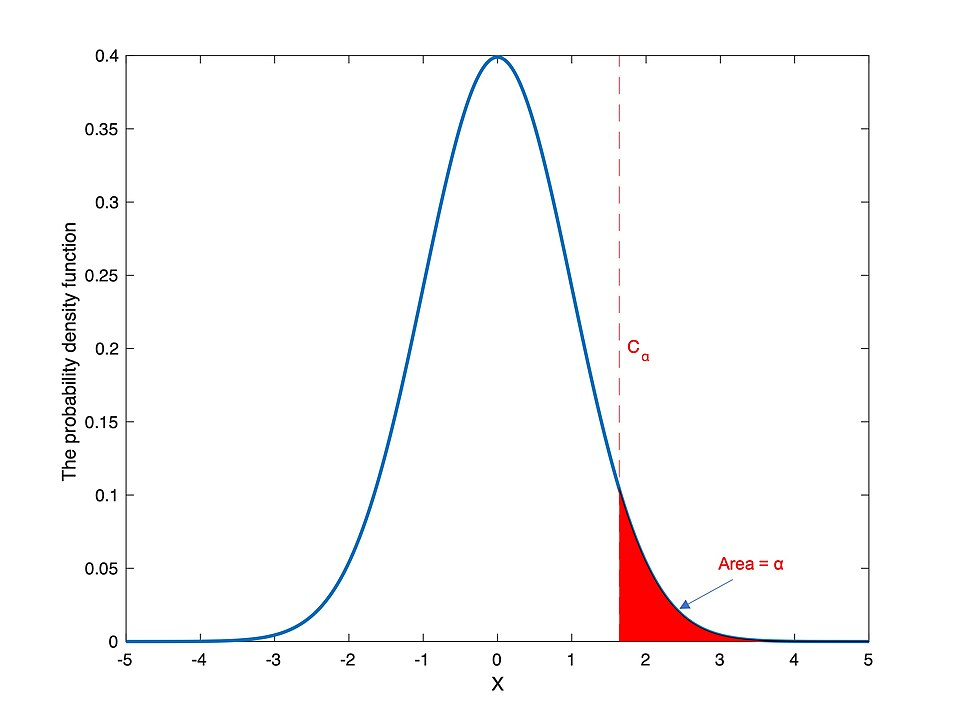
This figure displays a standard normal curve with a shaded rejection region for a chosen significance level α. The vertical marker indicates the critical value that separates typical outcomes from statistically significant ones in a one-tailed test. Additional numerical labels, if present, extend slightly beyond the subsubtopic but align with α’s role as a decision threshold. Source.
Lower α values represent stricter evidence requirements for rejecting the null hypothesis.
Significance Level (α): The predetermined probability of rejecting the null hypothesis when it is actually true.
Because α establishes the standard against which the p-value is evaluated, it directly shapes how strong the observed evidence must be to justify rejecting the null hypothesis.
Understanding the p-Value as a Decision Metric
The p-value is computed from the test statistic and conveys the probability of observing results as extreme as those found in the sample if the null hypothesis were true. Small p-values indicate that the sample data would be unusual under the null model, implying that the null hypothesis may not adequately explain the observed outcomes. Large p-values suggest that the data are consistent with the null hypothesis’s expectations.
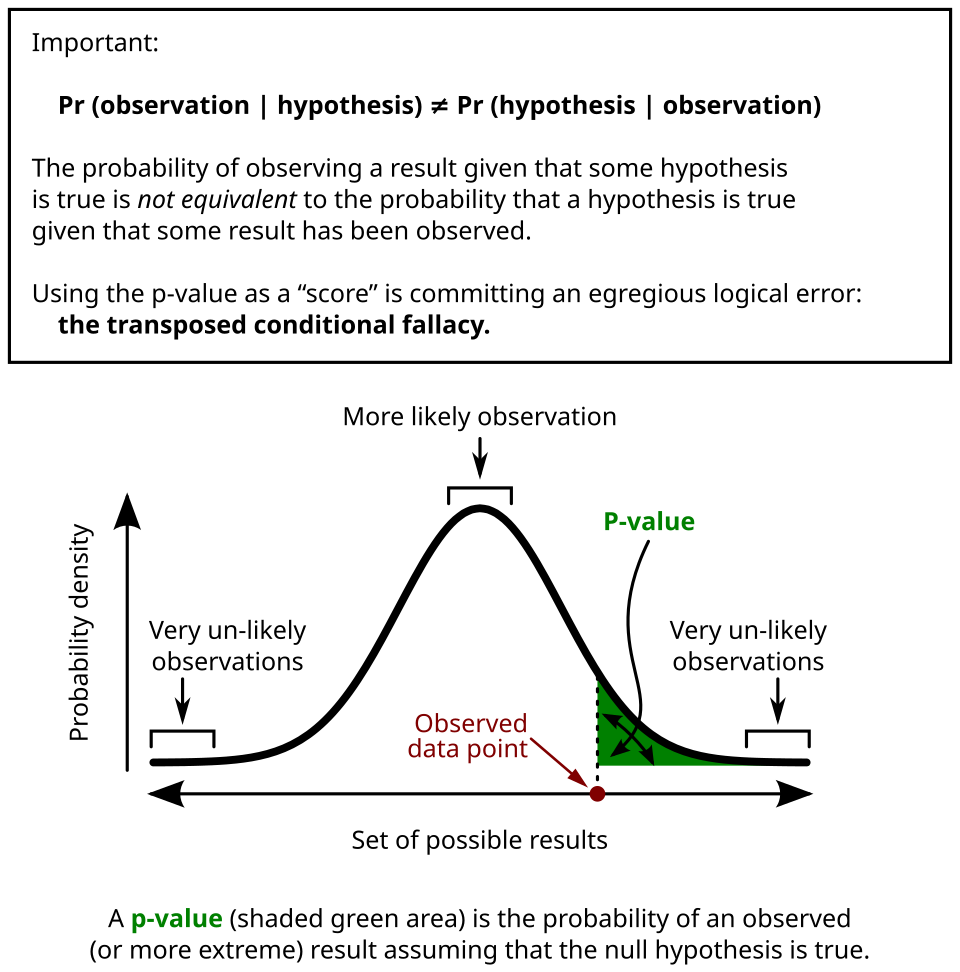
This diagram illustrates a sampling distribution under the null hypothesis, with the shaded tail area representing the p-value. It highlights how the p-value quantifies the extremeness of the observed test statistic assuming the null hypothesis is true. Supplemental labels help reinforce the conceptual meaning of the shaded region. Source.
Making the Decision
Formal decisions rely on a simple comparison rule that ensures consistent interpretation across all one-sample and two-sample significance tests for proportions. These rules do not quantify the truth of a hypothesis but instead measure whether the sample evidence is sufficiently inconsistent with the null hypothesis to justify favoring the alternative.
Decision Rule:
If p-value ≤ α, reject the null hypothesis.
If p-value > α, fail to reject the null hypothesis.
This rule forms the core of statistical inference because it ensures that decisions align with the predetermined tolerance for Type I error.
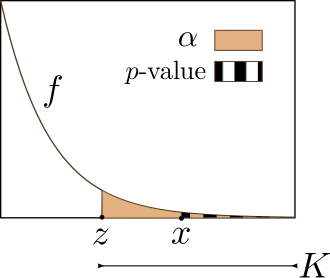
This figure compares the p-value with the significance level α by showing their positions on a probability distribution curve. The shaded regions illustrate whether the observed test statistic falls into the rejection region. Any references to alpha error correspond to Type I error, which is consistent with α’s interpretation. Source.
Interpreting “Reject” and “Fail to Reject”
In hypothesis testing, the phrase reject the null hypothesis indicates that the data provide strong enough evidence to support the alternative hypothesis. This does not prove the alternative is true, but it suggests the null hypothesis is unlikely under the observed conditions.
Conversely, failing to reject the null hypothesis means that the data do not provide convincing evidence for the alternative. It does not confirm the null hypothesis; it simply reflects insufficient evidence to overturn it.
Null Hypothesis (H₀): A statement asserting a specific value of a population parameter, tested as the default assumption in a statistical procedure.
A sentence should appear here before introducing another formal definition, ensuring clarity between conceptual elements.
Alternative Hypothesis (Hₐ): A statement proposing a difference or effect, supported when the evidence contradicts the null hypothesis strongly enough.
These interpretations emphasize evidence rather than truth claims, aligning statistical decision-making with uncertainty-based reasoning.
Why the Formal Process Matters
Using the p-value and α together provides transparency and consistency in statistical decisions. Researchers must follow these rules exactly to avoid biased interpretations and maintain the integrity of hypothesis testing. Because statistical inference relies on random samples, using predefined decision thresholds prevents subjective judgments and ensures that the evidence standard remains constant for all tests conducted at the same significance level.
Practical Considerations in Decision-Making
When selecting α and interpreting decisions, it is essential to keep the context and consequences in mind. Some studies may require strong evidence before rejecting the null hypothesis, motivating a smaller α. Others may tolerate more uncertainty if missing a true effect would have meaningful consequences. Regardless of the context, the decision rule based on comparing the p-value with α remains constant, reflecting the structured nature of statistical inference.
This decision framework links sample evidence and theoretical probability, ensuring that conclusions about population parameters follow logically from the structure of the hypothesis test.
FAQ
When the p-value is very close to the significance level, the formal decision rule still applies strictly: values just above alpha lead to failing to reject the null hypothesis, and values just below alpha lead to rejection.
However, statisticians often comment on the result’s sensitivity. A p-value close to alpha indicates that a minor change in data or methodology could alter the decision, so researchers may note this uncertainty when interpreting results in context.
No. The significance level must be set before analysing the data. Choosing it afterwards introduces severe bias.
Pre-selecting alpha ensures that the decision rule is objective and not influenced by a desire to obtain a particular outcome.
Researchers may, however, report additional p-values or confidence levels, provided that the originally stated significance level remains the basis for formal decision-making.
The formal comparison of p-value and alpha is identical for both test types, but the interpretation of the p-value differs.
For a one-sided test, the p-value represents the probability of observing a result in the specified direction only.
For a two-sided test, the p-value accounts for extremeness in both directions.
This affects how much evidence is required to reject the null hypothesis: two-sided tests typically require stronger data evidence due to the split tail areas.
Yes. A small p-value supports rejecting the null hypothesis, but uncertainty arises when:
• the sample size is small,
• the data collection process has limitations, or
• the effect size is trivial despite statistical significance.
Formal decisions rely on the p-value, but researchers often note practical considerations to avoid overstating the strength or importance of the result.
Failing to reject occurs when evidence is insufficient, not when evidence supports the null hypothesis.
This may happen because:
• the sample size is too small to detect meaningful differences,
• the effect exists but the study lacked power, or
• sampling variation produced a p-value above alpha.
Thus, the result reflects limited evidence rather than confirmation of the null hypothesis.
Practice Questions
Question 1 (1–3 marks)
A researcher conducts a hypothesis test at the 5% significance level. The p-value obtained is 0.032.
(a) Based on the p-value and significance level, what formal decision should the researcher make?
(b) Provide a brief justification for this decision.
Question 1 (1–3 marks)
(a) 1 mark for stating the correct decision: reject the null hypothesis.
(b) 1–2 marks for justification:
1 mark for noting that the p-value (0.032) is less than the significance level (0.05).
1 mark for explaining that this indicates sufficient evidence against the null hypothesis.
Question 2 (4–6 marks)
A survey is carried out to test whether the proportion of customers satisfied with a new service differs from 0.80. A two-sided hypothesis test is conducted at the 1% significance level. The resulting p-value is 0.014.
(a) State the formal decision regarding the null hypothesis.
(b) Explain the reasoning behind this decision in the context of hypothesis testing.
(c) Briefly comment on why failing to reject the null hypothesis does not imply that it is true.
Question 2 (4–6 marks)
(a) 1 mark for correct decision: fail to reject the null hypothesis.
(b) 2–3 marks for explanation:
1 mark for stating that the p-value (0.014) is greater than the significance level (0.01).
1 mark for noting that the evidence is not strong enough to support the alternative hypothesis.
1 mark for clearly linking the decision rule (p-value compared with alpha) to the outcome.
(c) 1–2 marks for comment:1 mark for stating that failing to reject the null hypothesis does not prove it true.
1 mark for noting that the result simply indicates insufficient evidence to conclude a difference from 0.80.
