
AP Syllabus focus:
‘The results of a significance test for a population proportion provide statistical reasoning to support an answer to a research question about the population. It is critical to frame the conclusion of the significance test in the context of the original research question, clearly stating whether the observed data provide enough evidence to support a specific claim about the population proportion.’
A significance test for a population proportion offers a structured way to connect sample evidence to a broader research question, allowing statisticians to evaluate claims about population behavior.
Research Questions and Statistical Conclusions
A well-designed significance test enables researchers to address a research question, which is the overarching inquiry guiding the investigation. This question identifies the population of interest and the proportion being evaluated. Once the test has been carried out, the results must be interpreted through the lens of this question to determine whether the data provide statistical support for a specific claim.
Linking Test Outcomes to Research Claims
To meaningfully connect test results to the research question, a conclusion must be framed in context. This includes restating the population, the parameter, and the claim under consideration. The null hypothesis represents the claim being tested, while the alternative hypothesis expresses the possibility of an effect or difference that the researcher is seeking to support.
Null Hypothesis (H₀): A statement asserting no effect or no difference, used as the baseline assumption for a significance test of a population proportion.
A contextual conclusion does not merely state “reject” or “fail to reject”; it clarifies what the decision implies about the population.
Using Evidence to Support a Claim
A significance test produces a p-value, which quantifies how consistent the observed data are with the null hypothesis. Smaller p-values indicate stronger evidence against the null hypothesis. This evidence becomes the foundation for supporting or not supporting a research claim about the population proportion.
p-Value: The probability of obtaining a test statistic as extreme as or more extreme than the observed result, assuming the null hypothesis is true.
A clearly stated confidence interval can complement the significance test by showing which population proportion values remain plausible answers to the research question.
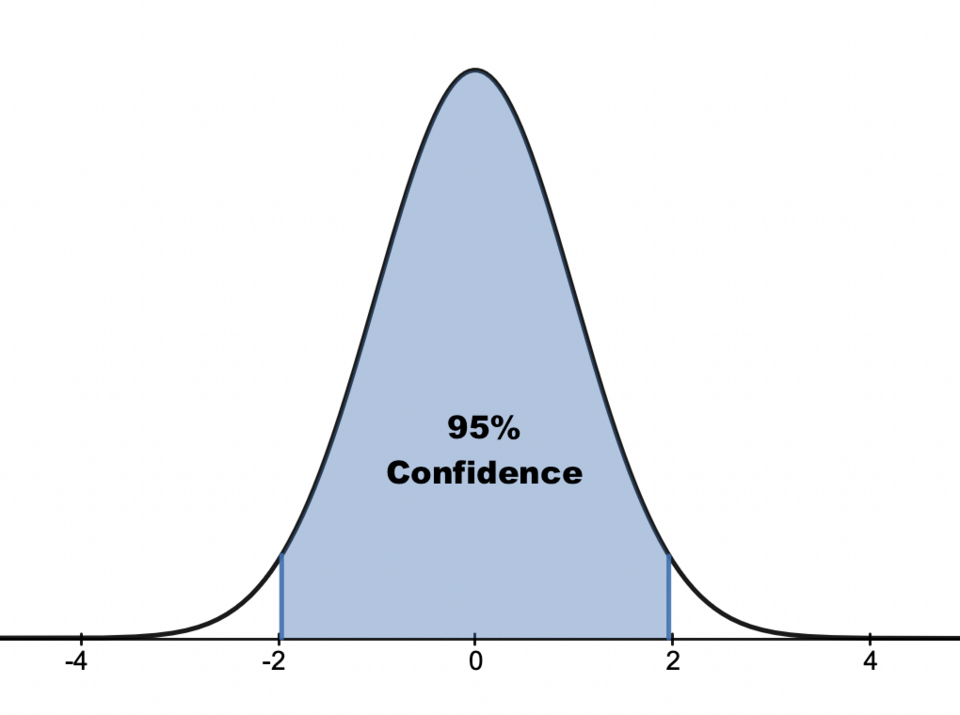
This diagram illustrates the central 95 percent of a normal distribution, showing how confidence intervals capture plausible parameter values for a population proportion in the context of a research question. Source.
After interpreting the p-value within the predetermined significance level (α), a formal decision is made. The decision must then be explicitly tied back to the research question.
Contextualizing the Decision
Once a test decision is made, it is essential to communicate what the evidence suggests about the population. The conclusion should:
Identify the population and parameter.
Relate the statistical decision to the research question.
Indicate whether the evidence supports or does not support the claim.
Avoid asserting certainty, since statistical conclusions are probabilistic rather than absolute.
A statement such as “There is sufficient evidence to support the claim that…” aligns the statistical result with the broader research purpose without overstating what the data can prove.
Avoiding Misinterpretation of Test Results
Significance tests do not prove hypotheses; instead, they assess whether sample evidence is strong enough to question the plausibility of the null hypothesis. Because sampling variability can lead to different outcomes across repeated samples, conclusions must be presented as inferential, not definitive.
Sampling Variability: The natural fluctuation in sample statistics that occurs when different random samples are drawn from the same population.
The p-value measures how surprising the sample proportion would be if the null hypothesis about the population proportion were actually true.
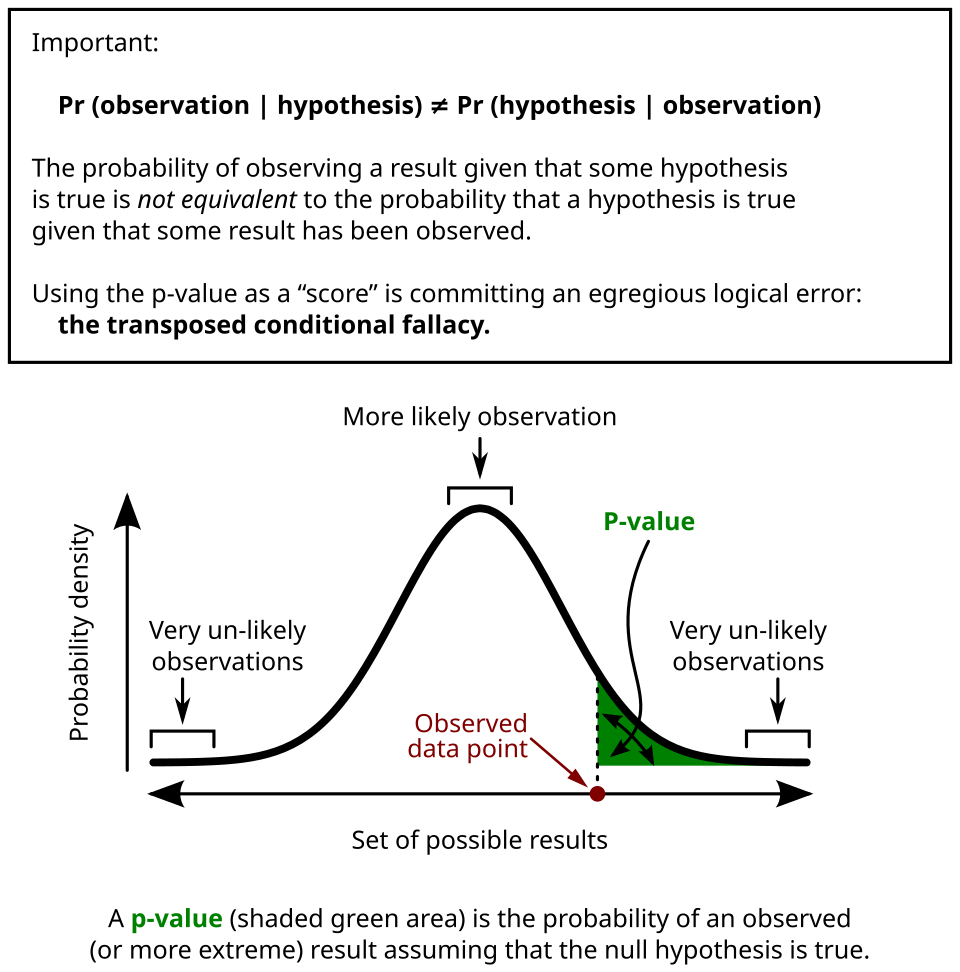
This figure shows a normal sampling distribution with the tail area shaded to represent the p-value, highlighting how the probability of obtaining an extreme result informs conclusions about the population proportion. Source.
Recognizing this limitation strengthens the clarity and accuracy of the interpretation offered in response to the research question.
Structuring a Research-Supported Conclusion
A well-framed conclusion typically incorporates these elements:
Restatement of the research question in terms of the population proportion.
Description of the statistical evidence, including the p-value and test decision.
Interpretation of the evidence in everyday language linked to the population.
Assessment of whether the data support the original claim.
Each component ensures that the significance test result directly answers the research question while maintaining statistical integrity.
Emphasizing Contextual Language
Since AP Statistics emphasizes communication, conclusions should avoid technical ambiguity. Terms such as “sufficient evidence”, “not enough evidence”, and “suggests” help maintain appropriate caution. Strong language implying proof or certainty must be avoided.
Careful wording also helps distinguish between failing to reject the null hypothesis and declaring it true. Failing to find evidence for a claim does not mean that the opposite claim is correct; it simply indicates that the sample data did not provide strong enough support.
Integrating Statistical Reasoning with Research Goals
Ultimately, the purpose of significance testing within AP Statistics is not solely to perform calculations but to use statistical reasoning to address real-world questions. The final conclusion ties methodology to meaning by demonstrating how the inferential process informs understanding of the population. Crafting such a conclusion ensures that statistical analysis directly supports the research question and maintains fidelity to the evidence collected.
FAQ
A conclusion should explicitly reference the population, the parameter being tested, and the claim under investigation. This ensures the reasoning is anchored to the real-world context, not just the statistical output.
A strong contextual conclusion states what the evidence suggests about the population, not about the sample. The more clearly the conclusion answers the original research question, the more meaningful it becomes for interpretation.
A significance test may provide strong statistical evidence, but this does not automatically mean the effect is meaningful in a practical or real-world sense.
Practical significance considers whether the observed difference or effect has real impact. A conclusion supporting a research question may therefore require both statistical support and contextual justification that the difference matters beyond sampling variation.
Confidence intervals offer a range of plausible values for the population proportion, helping to illustrate whether the hypothesised value is consistent with the data.
They can strengthen a conclusion by showing how far the plausible values lie from the null proportion, providing additional context for supporting or not supporting the research claim. Confidence intervals also help communicate uncertainty more intuitively than p-values alone.
Students often incorrectly state or imply that the null hypothesis has been proven true. This misrepresents the purpose of a significance test.
Avoid phrases such as:
• The null hypothesis is correct.
• We accept the null hypothesis.
• The data prove the claim.
Instead, emphasise that a lack of evidence is not evidence of no effect and that conclusions are probabilistic.
A persuasive conclusion integrates statistical results with the real-world context of the study.
Useful elements include:
• Clear naming of the population and parameter.
• A statement about whether the evidence supports the research claim.
• Justification referencing the p-value or test decision.
• Careful language indicating uncertainty.
These components work together to communicate how the data inform the research question without overstating certainty.
Practice Questions
A researcher conducts a significance test for a population proportion and obtains a small p-value. Explain what this result suggests about the research question in the context of the population. (1–3 marks)
Small p-value interpretation (1–3 marks)
• 1 mark: States that a small p-value suggests the observed data are unlikely if the null hypothesis were true.
• 1 mark: States that this provides evidence against the null hypothesis.
• 1 mark: Links the result to the research question by explaining that there is sufficient evidence to support the researcher’s claim about the population proportion.
A study investigates whether the proportion of residents in a town who support a new public transport initiative differs from 0.50. A random sample of residents is surveyed, and a significance test for a population proportion is carried out.
The result leads to a failure to reject the null hypothesis at the 5% significance level.
(a) Explain what this decision means in the context of the research question.
(b) Describe how the conclusion should be communicated to avoid misinterpretation.
(c) Outline two elements that must be included when framing a conclusion that supports or does not support a claim about the population.
(4–6 marks)
Significance test conclusion (4–6 marks)
(a) Meaning of failing to reject (2 marks)
• 1 mark: States that the data do not provide sufficient evidence against the null hypothesis.
• 1 mark: Clearly connects this to the research question, stating that the sample does not provide strong enough evidence to conclude that the true proportion of supporters differs from 0.50.
(b) Communicating the conclusion (1–2 marks)
• 1 mark: States that the conclusion must avoid implying the null hypothesis is true.
• 1 mark: Notes that language such as “not enough evidence” or “insufficient evidence to support the claim” should be used rather than definitive statements.
(c) Required elements in a well-framed conclusion (2 marks)
• 1 mark: Identifies restating the population and parameter in context.
• 1 mark: Identifies describing the statistical evidence (such as p-value and test decision) and indicating whether it supports the claim about the population.
Total: 6 marks
