
AP Syllabus focus:
'While significance tests can indicate whether to reject or not reject the null hypothesis based on statistical evidence, they do not prove the null hypothesis to be true. A lack of statistical evidence for the alternative hypothesis is not evidence for the null hypothesis. Understanding the limitations of significance testing is crucial in interpreting the results correctly and responsibly.'
This section explains why significance tests, though powerful, have important limitations and must be interpreted carefully to avoid incorrect claims about populations and real-world effects.
Limitations of Significance Testing
Significance tests are tools for making decisions about population parameters using sample data, but they are not infallible. Understanding their limits prevents common misinterpretations.
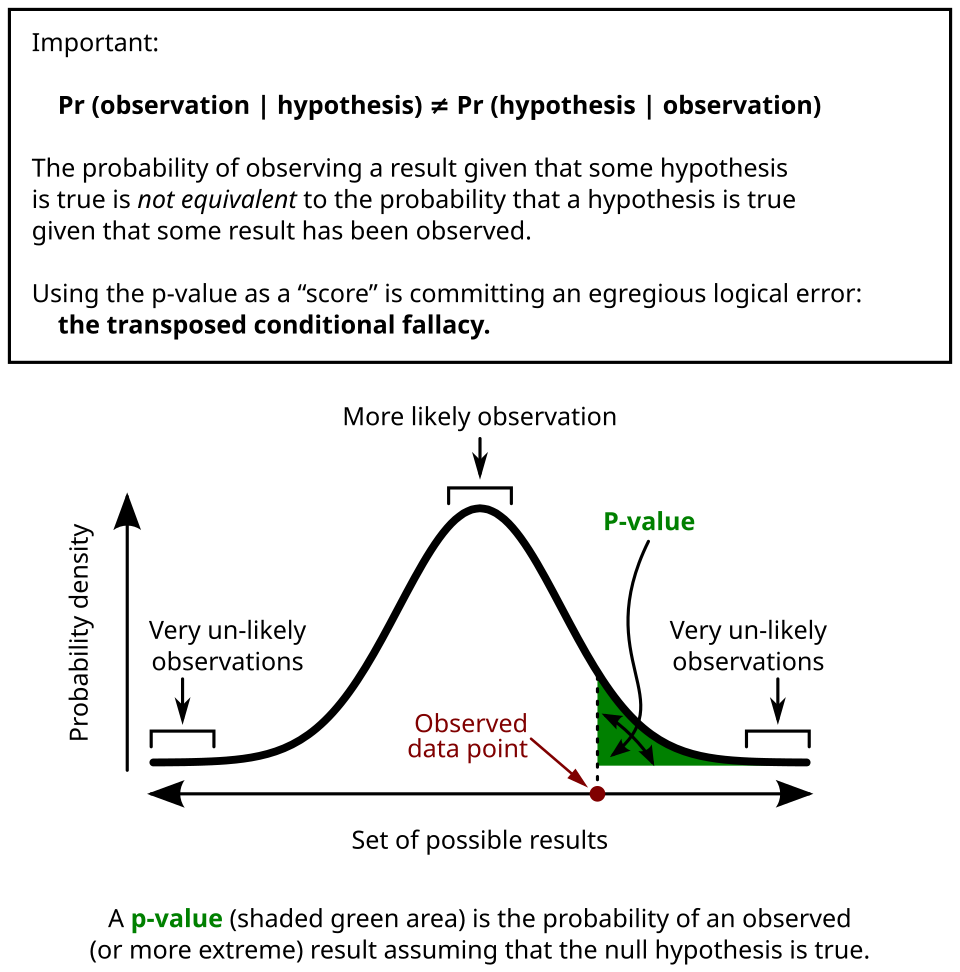
This graph illustrates a sampling distribution with the observed test statistic marked and the p-value represented as the shaded tail region, clarifying that the p-value measures extremeness under the assumption that the null hypothesis is true. Source.
Significance test: A procedure that uses sample data to assess evidence against a specified null hypothesis, usually by calculating a test statistic and p-value.
Failing to Reject is Not the Same as Proving the Null
A central limitation is that a significance test cannot ever prove the null hypothesis is true. It can only fail to find strong enough evidence against it.
When a test result is “fail to reject H0,” this means the data are not very inconsistent with H0, not that H0 has been verified.
Null hypothesis (H0): A claim about a population parameter, often representing no effect or no difference, that is tested against the alternative hypothesis.
Students must remember that weak evidence against Ha does not become positive evidence for H0. This is the meaning of “a lack of statistical evidence for the alternative hypothesis is not evidence for the null hypothesis.”
Dependence on the Significance Level
Significance tests rely on a chosen significance level α, such as 0.05. This is the cutoff used to decide whether to reject H0.
Because α is selected by the researcher, it is somewhat arbitrary. Different reasonable choices of α can lead to different decisions with the same data.
The meaning of α as the long-run probability of a Type I error (rejecting a true H0) shows that any single test result is subject to this error risk.

This diagram highlights how a p-value is compared with a chosen significance level α to determine whether to reject the null hypothesis, emphasizing that α is a researcher-defined threshold for Type I error. Source.
Role of Sample Size and Practical Importance
Significance tests are sensitive to sample size:
With a very large sample, even extremely small, practically unimportant differences from H0 can produce very small p-values and lead to rejecting H0.
With a very small sample, even large and practically important differences might not be detected, producing a large p-value and a “fail to reject H0” decision.
Therefore, statistical significance does not automatically mean practical significance, and the absence of statistical significance does not prove there is no meaningful effect.
Practical significance: The idea that an observed effect is large or important enough in the real-world context to matter, regardless of whether it is statistically significant.
In AP Statistics, students should always connect test results to the real context, asking whether the estimated difference or effect size matters in the situation being studied.
Assumptions and Data Quality
Another major limitation is that the validity of a significance test depends on meeting important conditions for inference:
Data should come from a random sample or randomized experiment to justify generalizing to the population.
Observations must be approximately independent; for sampling without replacement, the 10% condition helps support this.
The sampling distribution of the test statistic must be approximately normal, often justified using conditions on sample size and expected counts.
If these conditions are not met, the p-value and the decision about H0 may be misleading. Poorly collected or biased data cannot be “fixed” by applying a formal test.
Multiple Testing and Researcher Choices
Significance testing also has limitations when many tests are performed:
If many hypotheses are tested at the same α level, some will be rejected just by chance, even when all null hypotheses are actually true.
Searching through many different models, variables, or subgroups until a small p-value appears (often called data snooping or p-hacking) increases the chance of false positive results.
These issues show that the usual interpretation of α and the p-value relies on a pre-planned, single test, not on repeated searching for significance.
Communicating Results Responsibly
Because significance tests do not prove H0 true and are affected by assumptions, sample size, α, and researcher decisions, conclusions must be worded carefully.
Good practice includes:
Stating “fail to reject H0” instead of “accept H0.”
Describing the strength of evidence rather than treating the decision as absolute.
Connecting statistical evidence to context, effect sizes, and, when available, confidence intervals.
These habits reflect the syllabus emphasis that understanding the limitations of significance testing is crucial for interpreting results correctly and responsibly.
FAQ
A fixed p-value may be considered strong or weak evidence depending on the chosen significance level. For example, a p-value of 0.04 appears compelling at the 0.05 level but not at the 0.01 level.
This highlights that evidence is not absolute; it is interpreted relative to a threshold selected by the researcher, meaning the same data can lead to different decisions under different conventions.
The p-value is calculated assuming the null hypothesis is true, so it cannot simultaneously represent the probability of that assumption being correct.
A p-value reflects how unusual the observed data would be if the null hypothesis were correct, not the probability of correctness itself.
Describing it otherwise risks overstating certainty and ignoring limitations in the logic of significance testing.
Study design influences how trustworthy a significance test result is. Poor design can produce misleading p-values even when calculations are correct.
Key aspects include:
• Randomisation, which helps reduce systematic bias.
• Clear operational definitions, ensuring variables are measured consistently.
• Control of confounders, which prevents false signals of significance.
Weak design limits interpretability even if statistical significance is obtained.
When many tests are run, each has its own chance of producing a false positive. With enough tests, some will appear significant purely by chance.
This effect accumulates quickly. For instance, running 20 tests at the 0.05 level typically produces at least one false positive on average.
Adjustments such as Bonferroni corrections help mitigate this, but they do not eliminate the need for careful planning and cautious interpretation.
Significance tests reduce complex real-world questions to statistical hypotheses, which can oversimplify the underlying problem.
Context provides essential information such as:
• The practical importance of the effect being studied.
• The consequences of Type I and Type II errors.
• Whether assumptions reasonably reflect the real situation.
Without context, decisions based on significance testing risk being technically correct yet substantively misleading.
Practice Questions
Question 1 (1–3 marks)
A researcher conducts a significance test and obtains a large p-value. They conclude that the null hypothesis must be true.
(a) Explain why this conclusion is not justified.
(b) State the correct interpretation of a large p-value in the context of significance testing.
Question 1 (1–3 marks)
(a)
• 1 mark: States that failing to reject the null hypothesis does not prove it is true.
• 1 mark: Explains that a large p-value only indicates weak evidence against the null hypothesis, not confirmation of it.
(b)
• 1 mark: States that a large p-value means the observed data are consistent with the null hypothesis or not sufficiently inconsistent to reject it.
Total: 3 marks
Question 2 (4–6 marks)
A study tests whether a new teaching method improves pass rates. A significance test results in a small p-value, but the sample size used was extremely large.
(a) Explain why a small p-value does not necessarily imply that the teaching method has a meaningful effect.
(b) Describe two limitations of significance testing that should be considered when interpreting the result.
(c) Suggest one additional piece of information or approach that would help determine whether the effect is practically important.
Question 2 (4–6 marks)
(a)
• 1 mark: States that very large samples can detect trivial differences.
• 1 mark: Explains that statistical significance does not imply practical significance.
(b)
Any two of the following, up to 2 marks each (maximum 4 marks):
• Significance tests cannot prove the null hypothesis true or false; they only assess evidence.
• The chosen significance level is arbitrary and affects the decision.
• Results depend on assumptions such as independence and appropriate conditions; violations limit validity.
• Multiple testing or researcher choices may inflate false positives.
(2 marks for two clear limitations; 4 marks for two well-explained limitations.)
(c)
• 1 mark: Suggests examining effect size, confidence intervals, or practical significance.
• 1 mark: Explains how this additional information helps evaluate the real-world importance of the result.
Total: 6 marks
