
AP Syllabus focus:
‘Concluding a test involves interpreting the result in the context of the research question. Rejecting the null hypothesis suggests sufficient evidence for the alternative hypothesis within the context. Failing to reject the null hypothesis indicates insufficient evidence to support the alternative hypothesis, but does not prove the null hypothesis is true.’
Interpreting significance test results requires connecting statistical decisions to real-world questions, ensuring that conclusions meaningfully address the research context and correctly reflect the evidence provided by the data.
Interpreting Results in Context
Interpreting the result of a significance test is fundamentally about translating statistical outcomes into meaningful statements about the population and the research question. AP Statistics emphasizes that interpreting results is more than stating whether the null hypothesis was rejected; it requires articulating what that decision means for the situation being studied. Students must describe the evidence, specify the parameter, and frame the conclusion using the language of uncertainty central to all inferential reasoning.
Understanding Statistical Decisions
A statistical test leads to one of two formal decisions: rejecting the null hypothesis or failing to reject the null hypothesis. These decisions are grounded in the comparison between the p-value and the significance level. However, these outcomes must be interpreted carefully within context, acknowledging what the evidence does—and does not—show.
Null Hypothesis (H₀): A claim about the population parameter that represents no effect or no difference; it is the statement assessed by the test.
Rejecting or failing to reject H₀ does not signify certainty but instead reflects the strength of evidence the sample provides. Statistical inference always incorporates variability, so interpretations must communicate the probabilistic nature of conclusions.
When the Null Hypothesis Is Rejected
Rejecting the null hypothesis indicates that the sample provides sufficient statistical evidence in favor of the alternative hypothesis, given the chosen significance level. In context, this means the observed sample outcome would be unlikely if the null hypothesis were true, suggesting that the population parameter differs from the value stated in H₀.
Key elements of a contextualized conclusion when H₀ is rejected include:
Identifying the population proportion or other relevant parameter.
Clearly stating the direction of the difference when applicable.
Referencing the significance level (α) as the threshold for evidence.
Explaining that the evidence is statistical, not absolute.
This phrasing avoids overstating the certainty of the conclusion while still communicating that the data meaningfully contradict the null hypothesis.
When the Null Hypothesis Is Not Rejected
Failing to reject the null hypothesis indicates that the data do not supply strong enough evidence for the alternative hypothesis. However, this outcome does not imply that the null hypothesis is true. Instead, it reflects the limitations of the data—sample size, variability, or effect size—within the chosen significance level.
Fail to Reject H₀: A decision stating that available sample evidence is insufficient to conclude that the population parameter differs from the value hypothesized in the null hypothesis.
A contextual conclusion must emphasize:
The absence of sufficient evidence rather than proof of no effect.
The population and parameter under investigation.
The relationship between sample results and hypothesized values.
The key is to avoid definitive language such as “prove” or “confirm,” since hypothesis tests rely on probabilistic reasoning.
Integrating Context into Statistical Conclusions
A high-quality contextual conclusion directly links statistical decisions to the real research scenario. This requires students to:
Specify the parameter (e.g., a population proportion) clearly.
Use the context-specific description of the group, characteristic, or outcome measured.
Frame the decision in terms of evidence, not certainty.
To accomplish this effectively, conclusions should reference the research question, demonstrating how the statistical result supports or fails to support the claim being evaluated.
Communicating Evidence and Uncertainty
A strong interpretation acknowledges both the strength and limitations of statistical evidence. This involves stating that the decision is based on the observed sample relative to expectations under the null hypothesis and recognizing that different samples might lead to different results. Contextual conclusions should avoid implying that the test outcome guarantees a population-level truth.
Important communication principles include:
Using phrases such as “there is sufficient evidence to conclude…” when rejecting H₀.
Using phrases such as “there is not sufficient evidence to conclude…” when failing to reject H₀.
Avoiding deterministic statements about the population.
Highlighting that conclusions depend on the chosen significance level.
To make a formal decision, compare the p-value to the significance level α: if p ≤ α, reject H₀; if p > α, fail to reject H₀.
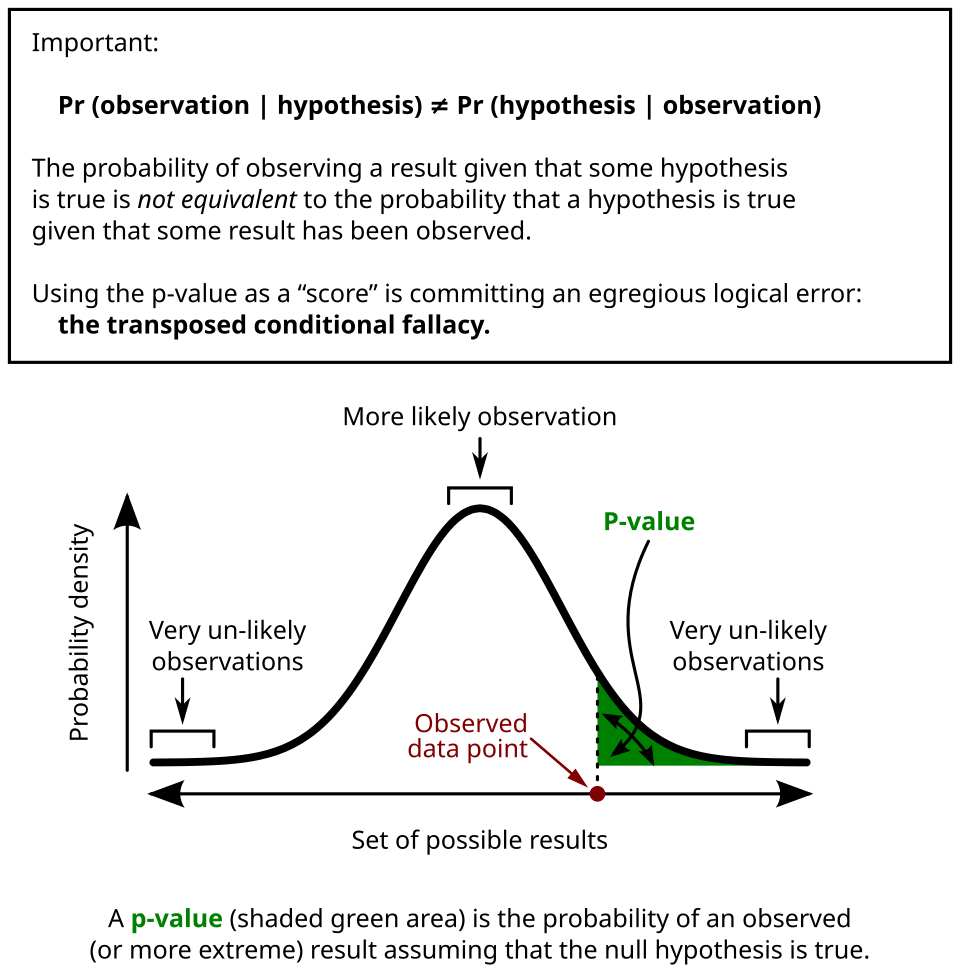
A probability curve illustrating the p-value as the shaded tail area representing the likelihood of observing a result at least as extreme as the test statistic under the null hypothesis. Source.
Graphically, the significance level defines rejection regions in the tails and a non-rejection region where sample results are considered consistent with the null hypothesis.
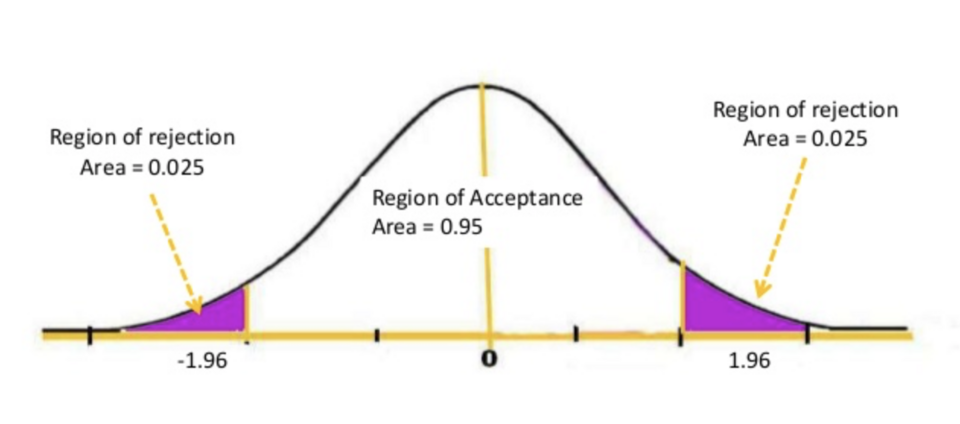
A normal distribution showing rejection regions in the tails and a central non-rejection region, demonstrating how the significance level partitions outcomes when deciding whether to reject the null hypothesis. Source.
A proper contextual conclusion always answers the prompt, describes evidence, and communicates uncertainty accurately.
Key Features of a High-Quality Contextual Conclusion
Clear identification of the parameter and population.
Correct use of statistical language about evidence.
Explicit reference to whether results support the alternative hypothesis.
Acknowledgment that failing to reject the null hypothesis does not prove it true.
Integration of contextual details from the scenario.
These components ensure that interpretations meet AP expectations by blending statistical reasoning with meaningful contextual explanation.
FAQ
Your conclusion should reference the population, the parameter, and the scenario in a way that clearly links the statistical decision to the real-world question.
Avoid unnecessary detail. You do not need to restate the entire study design; simply identify who or what the proportion refers to and what claim is being assessed.
A frequent error is stating that failing to reject the null hypothesis proves it true.
Other common mistakes include:
• Ignoring the population or parameter in the conclusion
• Forgetting to connect the decision to the research question
• Using overly strong language such as claiming certainty
The conclusion is always framed by the significance level, because it determines how much evidence is required to reject the null hypothesis.
A stricter significance level (such as 0.01) requires stronger evidence, which may lead to different wording in the conclusion since the threshold for rejecting the null is higher.
Significance tests for proportions assess evidence about population parameters, not causation.
Unless the data come from a properly designed experiment, interpreting a result as showing cause and effect is inappropriate. Your conclusion should focus on whether there is statistical evidence for a difference or effect, not what caused it.
When the p-value is near the threshold, conclusions must emphasise the inherent uncertainty of inference.
Suitable phrasing includes:
• Evidence is marginal
• The decision depends on the pre-selected significance level
• Small changes in the data or alpha level could lead to a different decision
This reinforces that significance testing reflects probability, not certainty.
Practice Questions
Question 1 (1–3 marks)
A researcher conducts a significance test to determine whether the proportion of customers who prefer a new product differs from 0.50. The p-value of the test is 0.18, using a significance level of 0.05.
Based on this result, state the correct conclusion in context.
Mark Scheme for Question 1 (3 marks total)
• 1 mark for correctly stating that the result leads to failing to reject the null hypothesis.
• 1 mark for referencing that there is insufficient evidence to conclude that the population proportion differs from 0.50.
• 1 mark for including context (customers’ preference for the new product).
Question 2 (4–6 marks)
A school administrator believes that more than 60% of students support extending the lunch break. She collects a random sample of students and performs a significance test for a proportion. The test yields a p-value of 0.012 using a significance level of 0.05.
(a) State the correct decision (reject or fail to reject the null hypothesis).
(b) Write a full contextual conclusion, explaining what the result implies about student support for the extended lunch break.
(c) Explain why the conclusion does not prove the administrator’s belief to be true.
Mark Scheme for Question 2 (6 marks total)
Part (a): 1 mark
• 1 mark for stating that the null hypothesis is rejected.
Part (b): 3 marks
• 1 mark for stating there is sufficient evidence to support the alternative hypothesis (that support is greater than 60%).
• 1 mark for correctly referencing the population proportion (students at the school).
• 1 mark for providing a clear contextual conclusion linking the statistical decision to student support for extending the lunch break.
Part (c): 2 marks
• 1 mark for noting that statistical tests do not provide absolute proof; they indicate the strength of evidence.
• 1 mark for explaining that conclusions are based on sample data and subject to sampling variability, meaning the true proportion may still differ despite the test result.
