
AP Syllabus focus:
‘Small p-values (≤ α) provide convincing statistical evidence against the null hypothesis and in favor of the alternative hypothesis. Larger p-values (> α) indicate that the data are not unusual under the assumption of the null hypothesis and thus do not provide strong evidence against it. However, larger p-values do not confirm the null hypothesis.’
Statistical evidence in significance testing helps determine whether sample data meaningfully contradict a stated claim about a population. Understanding how p-values reflect evidence strengthens interpretation and communication of results.
Understanding Statistical Evidence in Significance Testing
Evaluating statistical evidence centers on how strongly the data contradict the null hypothesis—the assumption that there is no effect or no difference in the population. Evidence is quantified through the p-value, which measures how incompatible the observed data are with the null hypothesis.
The Role of the Null and Alternative Hypotheses
The null hypothesis (H₀) proposes a specific population value and is treated as the default assumption. The alternative hypothesis (Hₐ) states the claim that researchers seek evidence for. Statistical evidence must be assessed in relation to both hypotheses.
Null Hypothesis: A statement asserting a specific value for a population parameter, treated as true for the purpose of evaluating evidence.
A significance test evaluates whether the observed data fall far enough from what H₀ predicts to favor Hₐ instead.
Understanding p-Values as Measures of Evidence
The p-value quantifies how extreme the sample result is, assuming H₀ is true. Smaller values indicate stronger evidence against H₀, while larger values suggest that the observed data are consistent with it.
p-value: The probability of obtaining a statistic as extreme as, or more extreme than, the observed statistic if the null hypothesis is true.
Because p-values are probabilities, they always fall between 0 and 1.
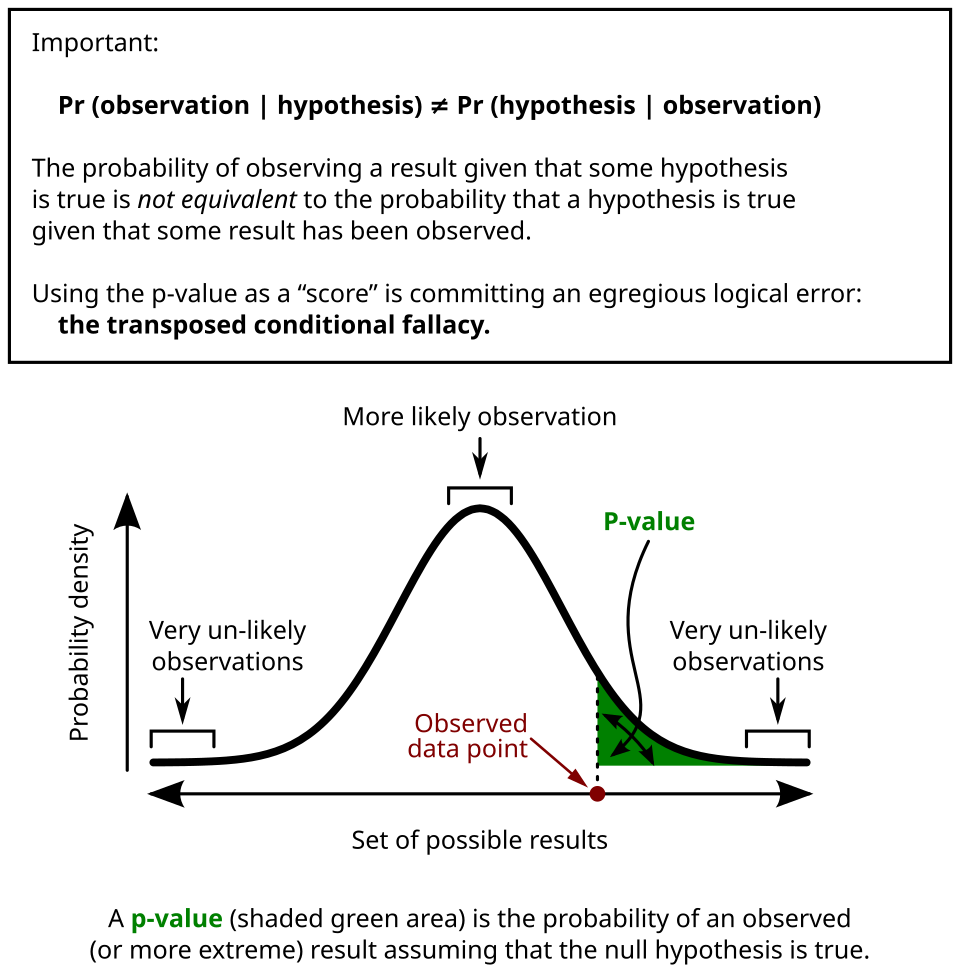
This diagram illustrates the p-value as the shaded tail area under the distribution, representing outcomes at least as extreme as the observed statistic when the null hypothesis is assumed true. Source.
Their interpretation is directly tied to the significance level, α.
Interpreting p-Values Relative to α
The syllabus emphasizes two essential ideas:
• Small p-values (≤ α) provide convincing evidence against H₀ and support Hₐ.
• Larger p-values (> α) suggest the data are not unusual under H₀ and therefore do not give strong evidence against it.
What Small p-Values Indicate
A small p-value signals that the sample outcome would rarely occur if H₀ were true. This rarity leads to the conclusion that H₀ is unlikely to reflect the population.
Important implications of small p-values include:
• Strong incompatibility between data and the null model
• Statistical justification to reject H₀
• Increased credibility of the alternative hypothesis
What Large p-Values Indicate—and What They Do Not
A large p-value indicates that the sample result aligns closely with what H₀ predicts. This lack of conflict means there is insufficient evidence to reject H₀. Crucially, this does not confirm H₀ as true.
Reasons a non-rejection does not prove H₀ include:
• The sample may be too small to detect meaningful differences
• True population effects may be subtle
• Variability in sampling can mask real deviations from H₀
Evaluating the Strength of Statistical Evidence
Statistical evidence is best understood on a continuum rather than as a simple reject/fail-to-reject decision. Students should consider how the size of the p-value reflects the strength of support for Hₐ.
Evidence Strength Categories
• Very small p-values (e.g., < 0.01): Strong evidence against H₀
• Moderate p-values (e.g., 0.01–0.05): Some evidence against H₀
• Large p-values (e.g., > 0.05): Weak or no evidence against H₀
This interpretation helps contextualize the findings within the research question.
Statistical vs. Practical Evidence
Even when statistical evidence is strong, context determines whether the detected effect is meaningful. Students must consider:
• Scope of inference
• Practical significance
• Study design quality
A statistically significant result does not automatically imply real-world importance.
Common Misinterpretations to Avoid
Several misconceptions can lead to misinterpretation of statistical evidence. Students should especially avoid:
• Believing a large p-value proves H₀
• Treating the p-value as the probability that H₀ or Hₐ is true
• Assuming that significance implies a large or important effect
• Interpreting p-values without connecting them to the study context
Recognizing these pitfalls strengthens accuracy and clarity in statistical communication.
Using Context to Evaluate Evidence
Interpretations must always be framed in terms of the population and research question. Effective evaluation of statistical evidence includes:
• Identifying what the test statistic measures
• Connecting the p-value to the claim being tested
• Explaining how the evidence relates to H₀ and Hₐ
• Integrating domain context to articulate a justified conclusion
A well-supported interpretation explicitly ties statistical results to the study’s goals and acknowledges uncertainty inherent in statistical inference.

This image contrasts the p-value area with the α cutoff region, showing how results are evaluated for statistical significance by comparing the observed p-value to the predetermined threshold. Source.
FAQ
The degree of conviction depends on how unlikely the observed data are under the null model. Very small p-values indicate that such results would rarely occur by random chance.
In practice, values below 0.01 are often considered strong evidence, while those between 0.01 and 0.05 provide moderate evidence. This distinction is qualitative rather than rule-based, and students should interpret it in context rather than relying on fixed cut-offs alone.
A p-value only reflects evidence against the null hypothesis, not the importance of the detected effect.
Differences may arise due to:
• Sample size
• Variability in measurements
• Size of the estimated effect
Thus, even with identical p-values, a study with a tiny effect may be practically unimportant while another with a sizeable effect may be meaningful.
Larger samples can detect small departures from the null hypothesis, often producing small p-values even when effects are minor. Smaller samples may produce large p-values simply due to limited sensitivity.
When evaluating evidence, consider whether the effect detected is meaningful, not just statistically significant. A small p-value in a large sample is not automatically compelling without contextual interpretation.
A large p-value simply indicates that the observed data are compatible with the null model; it does not assess the truth of the null hypothesis itself.
There may be insufficient sensitivity due to:
• Small sample size
• High variability
• Minimal differences between the null value and reality
Therefore, failing to reject H0 typically reflects a lack of evidence rather than confirmation.
Borderline values, such as 0.048 or 0.052, often indicate ambiguous evidence rather than a clear decision boundary.
It is sensible to:
• Examine the size and direction of the effect
• Consider the study design and measurement precision
• Reflect on whether the significance level is justified for the context
Evidence should be viewed as a continuum rather than a strict binary decision.
Practice Questions
Question 1 (1–3 marks)
A researcher tests whether the proportion of adults who prefer a new product differs from 0.50. The test produces a p-value of 0.18 at a significance level of 0.05.
a) State whether the null hypothesis should be rejected. (1 mark)
b) Briefly explain what the p-value indicates about the strength of evidence against the null hypothesis. (2 marks)
Mark scheme:
a) 1 mark: Correct decision — fail to reject the null hypothesis.
b) 1 mark: States that a p-value of 0.18 is large relative to 0.05.
1 mark: Indicates that the evidence against the null hypothesis is weak / not convincing.
Question 2 (4–6 marks)
A survey is conducted to test whether the proportion of customers satisfied with a service is less than 0.80. The researcher obtains a p-value of 0.012 using a one-sided test with significance level 0.05.
a) Explain what the p-value measures in the context of this study. (2 marks)
b) Evaluate whether the p-value provides strong statistical evidence against the null hypothesis, making reference to the significance level. (2 marks)
c) Briefly state why a small p-value does not prove that the alternative hypothesis is true. (1–2 marks)
Mark scheme:
a) 1 mark: Identifies that the p-value is the probability of observing a result as or more extreme assuming the null hypothesis is true.
1 mark: Must be contextualised to customer satisfaction proportion.
b) 1 mark: States that 0.012 is less than 0.05.
1 mark: Concludes that this provides strong evidence against the null hypothesis and supports the alternative.
c) 1 mark: Recognises that statistical tests rely on sample data subject to variability.
1 mark: States that a small p-value does not confirm the parameter value under the alternative; it only indicates inconsistency with the null.
