
AQA Specification focus:
‘The various factors that shift the AD curve and the short-run AS curve.’
Introduction
Aggregate demand (AD) and short-run aggregate supply (SRAS) are influenced by numerous factors. Understanding what causes shifts in these curves is essential for macroeconomic analysis.
Aggregate Demand (AD) Shifts
What AD Represents
Aggregate demand (AD) is the total demand for all goods and services in an economy at a given overall price level and time. It is the sum of consumption (C), investment (I), government spending (G), and net exports (X – M).
Aggregate Demand (AD): The total planned expenditure on goods and services in an economy at a given price level, calculated as AD = C + I + G + (X – M).
Shifts in the AD curve occur when factors affect any of these components independently of the price level.
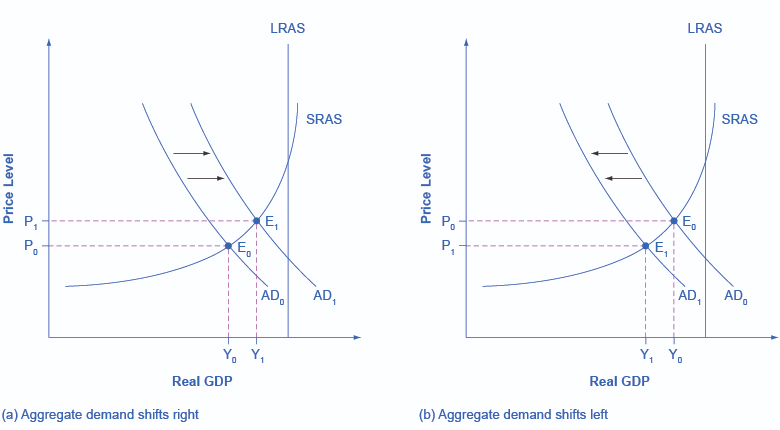
This diagram demonstrates how variations in consumption, investment, government spending, and net exports can cause the Aggregate Demand curve to shift. An increase shifts AD to the right, while a decrease shifts it to the left. Source
Key Determinants of AD Shifts
Consumption (C):
Influenced by income levels, interest rates, consumer confidence, taxation, and wealth effects (e.g., housing or stock market changes).Investment (I):
Driven by business confidence, interest rates, government policy (taxes, subsidies), availability of credit, and future expectations of profit.Government Spending (G):
Decisions on fiscal policy, such as increasing or reducing spending, directly shift AD.Exports (X):
Dependent on global demand, foreign income levels, and exchange rates.Imports (M):
Influenced by domestic income levels and exchange rates, as higher domestic income often increases import demand.
Impact of Fiscal and Monetary Policy
Expansionary fiscal policy (higher government spending, lower taxation) shifts AD rightwards.
Tighter fiscal policy (lower spending, higher taxation) shifts AD leftwards.
Monetary policy affects AD via interest rates, money supply, and credit availability, influencing both consumption and investment.
Short-Run Aggregate Supply (SRAS) Shifts
What SRAS Represents
Short-run aggregate supply (SRAS) refers to the total quantity of goods and services producers are willing and able to supply at different price levels, assuming fixed input costs such as wages in the short run.
Short-Run Aggregate Supply (SRAS): The total output producers in an economy are willing to supply at a given overall price level, assuming at least one factor of production is fixed.
Shifts in SRAS occur due to changes in production costs or supply-side conditions, independent of the price level.
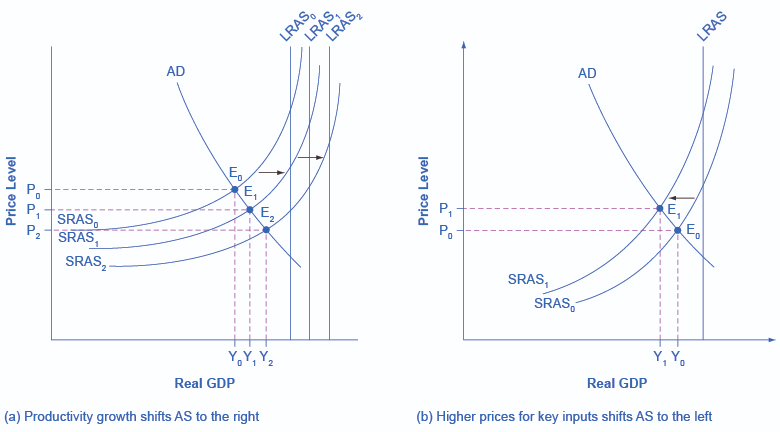
This diagram illustrates how changes in input prices, productivity, and supply-side shocks can shift the Short-Run Aggregate Supply curve. Higher costs shift SRAS left, while improvements shift it right. Source
Determinants of SRAS Shifts
Input Costs:
Wage rates: Rising wages increase production costs, shifting SRAS left.
Raw material prices: Higher oil or commodity prices increase costs.
Business Taxation and Subsidies:
Higher business taxes increase costs, shifting SRAS left.
Subsidies lower costs, shifting SRAS right.
Productivity:
Improvements in labour productivity reduce average costs, shifting SRAS right.
Declines in efficiency shift SRAS left.
Supply-Side Shocks:
Natural disasters, strikes, or energy shortages reduce supply capacity.
Favourable shocks (e.g., technological advances) shift SRAS right.
Distinguishing Between AD and SRAS Shifts
AD Curve Shifts
Always caused by changes in demand-side components (C, I, G, X – M).
Examples:
A cut in interest rates → more borrowing, higher consumption and investment → AD shifts right.
A global recession reducing UK exports → AD shifts left.
SRAS Curve Shifts
Always caused by changes in production costs and supply conditions.
Examples:
Rising oil prices increase costs → SRAS shifts left.
Improved technology boosts efficiency → SRAS shifts right.
Visual Representation
On a diagram:
A shift in AD moves the curve left or right.
A shift in SRAS also moves the curve left or right, but for different underlying reasons.
These shifts affect macroeconomic equilibrium, influencing output (real GDP) and the general price level.
Interactions Between AD and SRAS Shifts
Rightward shift in AD with constant SRAS: Raises both real GDP and the price level (demand-pull inflation).
Leftward shift in SRAS with constant AD: Reduces GDP but increases price level (cost-push inflation).
Simultaneous shifts: The net effect depends on the magnitude and direction of each curve’s movement.
Practice Questions
State two factors that can cause a rightward shift of the aggregate demand (AD) curve. (2 marks)
1 mark for each correct factor identified, up to 2 marks.
Acceptable answers include: increase in government spending, fall in interest rates, rise in consumer confidence, increase in exports, rise in investment, tax cuts.
Explain how an increase in wage rates and an increase in consumer confidence would affect the short-run aggregate supply (SRAS) curve and the aggregate demand (AD) curve. (6 marks)
1–2 marks: Identification of wage rise effect on SRAS (higher costs, SRAS shifts left).
1–2 marks: Identification of consumer confidence effect on AD (higher spending, AD shifts right).
1–2 marks: Clear explanation of the impact on each curve (AD shifts right due to higher consumption, SRAS shifts left due to higher production costs).
To access top marks (5–6): Candidate must show clear understanding of both shifts, explicitly linking them to equilibrium outcomes (higher price level from both, but uncertain effect on real output depending on the magnitude of shifts).
FAQ
A movement along the AD curve happens when the general price level changes, altering the quantity of real output demanded.
A shift of the AD curve occurs when a non-price factor, such as investment or government spending, changes. This affects overall demand at every price level.
Business confidence determines firms’ willingness to invest. If confidence is high, firms increase spending on capital projects, shifting AD to the right.
If confidence falls, firms delay or cut investment, shifting AD to the left. This makes confidence a crucial determinant in shaping demand-driven growth.
A depreciation of the exchange rate makes exports cheaper and imports more expensive.
Exports rise, increasing demand for domestic goods.
Imports fall, as consumers switch to local alternatives.
Together, these changes shift AD to the right. Conversely, an appreciation of the exchange rate typically shifts AD leftward.
Supply-side shocks can be sudden and vary in scale. For example:
A natural disaster might sharply reduce output.
A technological innovation could boost productivity.
Because they are unexpected and can either raise or reduce output capacity, their precise impact on SRAS is difficult to predict in advance.
Subsidies reduce production costs, encouraging firms to produce more at every price level. This shifts SRAS to the right.
In contrast, higher business taxes raise costs, shifting SRAS to the left. The two policies therefore act as direct opposites in their effect on short-run aggregate supply.
