
AQA Specification focus:
‘Changes in the price level are represented by movements along the aggregate demand (AD) and aggregate supply (AS) curves.’
Understanding how movements along the AD and AS curves occur is central to macroeconomic analysis. These shifts reflect changes in the general price level, not underlying conditions.
Aggregate Demand and Price Level Changes
The aggregate demand (AD) curve shows the relationship between the overall price level and the total quantity of goods and services demanded. It is downward sloping due to three key effects:
The real balances effect: higher prices reduce the real value of money, lowering consumption.
The interest rate effect: rising prices increase demand for money, raising interest rates and discouraging investment.
The net exports effect: higher domestic prices reduce competitiveness abroad, decreasing exports and increasing imports.
Movements Along the AD Curve
A movement along the AD curve happens when the price level changes, but all other factors remain constant.
A rise in the price level leads to a contraction in AD (a movement up the curve).
A fall in the price level leads to an expansion in AD (a movement down the curve).
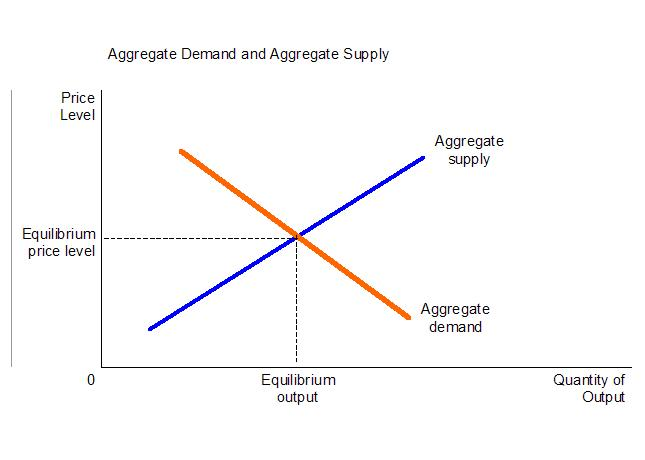
This diagram depicts the aggregate demand and aggregate supply curves, showing how a change in the price level leads to a movement along the AD and AS curves, affecting equilibrium output and price levels. Source
Movement along the AD curve: A change in the total quantity of real output demanded in the economy resulting solely from a change in the general price level.
This is different from a shift in the AD curve, which results from changes in components of AD such as consumption, investment, government spending, or net exports.
Aggregate Supply and Price Level Changes
The aggregate supply (AS) curve illustrates the relationship between the general price level and the quantity of goods and services firms are willing to supply.
Short-Run Aggregate Supply (SRAS)
In the short run, the AS curve is upward sloping. Higher prices encourage firms to increase output because:
Wages and input costs are relatively sticky.
Higher prices allow for higher revenues and profits.
A movement along the SRAS curve occurs when the price level changes, holding other factors such as wages, productivity, and taxation constant.
Rising prices cause an expansion in output along the SRAS.
Falling prices cause a contraction in output along the SRAS.
Movement along the SRAS curve: A change in the total quantity of real output supplied in the economy resulting solely from a change in the general price level.
Long-Run Aggregate Supply (LRAS)
The LRAS is vertical at full employment output, reflecting the economy’s maximum sustainable level of production. Movements along the LRAS are not meaningful because in the long run, output is determined by productive capacity, not the price level.
Distinguishing Movements from Shifts
Students often confuse movements along curves with shifts of curves. The distinction is crucial for accurate analysis.
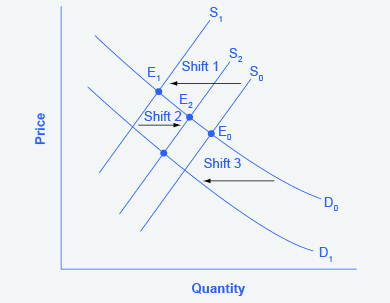
This illustration contrasts shifts of demand or supply curves with movements along them, emphasizing that price changes cause movements along the curves, while other factors cause shifts. Source
Movements along curves: Caused by price level changes.
Shifts of curves: Caused by changes in non-price factors (e.g., productivity, fiscal policy, investment).
For clarity:
If prices change → movement.
If determinants of AD or AS change → shift.
The Role of Equilibrium in Movements
Equilibrium in the macroeconomy occurs where AD intersects AS. A movement along either curve, caused by a change in price level, alters the equilibrium position.
Example of AD Movements
When prices rise, movement up the AD curve leads to lower equilibrium real output and higher equilibrium prices (demand contracts).
When prices fall, movement down the AD curve increases equilibrium real output and lowers equilibrium prices (demand expands).
Example of SRAS Movements
If prices rise, movement along the SRAS leads to higher output as firms increase production in response to greater profit opportunities.
If prices fall, firms cut production due to reduced profitability.
Factors Ensuring Only Price-Level Movements
To analyse movements correctly, all non-price determinants must be assumed constant:
In AD: income levels, consumer confidence, government policies, and global trade conditions are unchanged.
In SRAS: wages, productivity, taxation, and raw material costs are unchanged.
This assumption allows economists to isolate the pure effect of price changes on output levels.
Graphical Representation in Analysis
When illustrating this in diagrams:
A price level change is shown as a movement along the existing AD or AS curve.
A shift would require drawing a new AD or AS curve to the left or right.
Students should practice carefully labelling axes:
Vertical axis: general price level.
Horizontal axis: real GDP (output).
Importance in A-Level Economics
Recognising movements along AD and AS curves is vital because:
It underpins accurate analysis of inflationary and deflationary changes.
It helps explain why output fluctuates when price levels change.
It supports understanding of how policies affect equilibrium in the short run versus the long run.
In exams, students are expected to:
Clearly distinguish between movements and shifts.
Correctly use diagrams to demonstrate changes in equilibrium output and prices.
Accurately link movements to broader macroeconomic contexts, such as inflationary pressures or recessionary gaps.
Practice Questions
Explain what is meant by a movement along the aggregate demand (AD) curve. (2 marks)
1 mark for stating that a movement along the AD curve is caused by a change in the general price level.
1 mark for explaining that this leads to a change in the quantity of real output demanded, with other factors held constant.
Using an aggregate demand and aggregate supply (AD/AS) diagram, explain the difference between a movement along the AD curve and a shift of the AD curve. (6 marks)
1 mark for correctly stating that a movement along the AD curve occurs due to a change in the price level.
1 mark for noting that this affects the quantity of real output demanded.
1 mark for correctly stating that a shift of the AD curve occurs when a non-price determinant (such as consumption, investment, government spending, or net exports) changes.
1 mark for explaining that a rightward shift increases demand at every price level (or leftward shift decreases demand).
1 mark for correctly using an AD/AS diagram to illustrate both a movement along and a shift.
1 mark for clear economic explanation linking back to equilibrium output and price level changes.
FAQ
The AD curve slopes downward because higher prices reduce the real value of income, discourage investment due to higher interest rates, and make exports less competitive.
These effects — the real balances effect, interest rate effect, and net exports effect — combine to explain why a rise in the general price level contracts demand.
A contraction in AD refers to a movement up the AD curve when the price level rises, reducing output demanded.
A decrease in AD means the entire AD curve shifts left, caused by factors such as reduced consumption or lower government spending.
The LRAS curve is vertical at the full employment level of output.
Because output in the long run is determined by productive capacity, price level changes do not cause movements along LRAS.
Equilibrium occurs where AD intersects AS.
When the price level changes, movements along AD and SRAS alter this equilibrium:
Higher prices reduce demand and may increase supply.
Lower prices expand demand but may reduce supply.
Demand-pull inflation: A higher price level moves the economy up the AD curve, contracting demand but still raising prices.
Cost-push inflation: A rising price level causes a movement along SRAS, reducing output as firms face higher costs.
