Edexcel Syllabus focus:
'Analyse and interpret data on the possible health significance of blood cholesterol levels, including HDL and LDL levels.'
Blood cholesterol data are useful only when interpreted carefully. For Edexcel, focus on what HDL and LDL represent, how results are compared, and what patterns suggest a higher or lower cardiovascular risk.
Cholesterol and lipoproteins
Cholesterol is an important lipid in cell membranes and is used to make steroid hormones and bile salts. It is not transported freely in plasma because lipids are not soluble in water-based blood.
Lipoprotein: A particle made of lipid and protein that transports insoluble lipids, including cholesterol, in the blood.
Lipoproteins differ in the proportion of lipid and protein they contain.
Protein increases density, so HDL is denser than LDL. In exam questions, this difference in density matters less than the different transport roles of the two particles.
Blood test results usually report cholesterol as a concentration. A result is therefore interpreted by comparing values, looking for patterns, and considering whether HDL and LDL change in the same or opposite directions.
HDL and LDL
Most questions focus on high-density lipoprotein (HDL) and low-density lipoprotein (LDL).
HDL: High-density lipoprotein; a lipoprotein that carries cholesterol from body tissues back to the liver.
HDL is often called “good cholesterol” because it helps remove cholesterol from tissues. A higher HDL concentration is usually associated with a more favorable blood lipid profile.
LDL carries cholesterol from the liver to body cells. This is a normal and necessary role because cells need cholesterol. However, if LDL levels are high, more cholesterol is available to be deposited in artery walls.
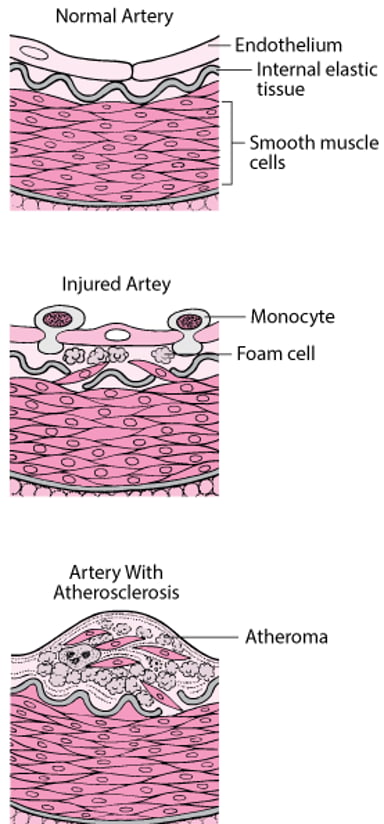
Diagram comparing a normal artery with an artery containing atherosclerotic plaque, illustrating how plaque narrows the lumen and restricts blood flow. It provides a visual mechanism for why elevated LDL-associated cholesterol is treated as a higher cardiovascular risk signal in exam-style data questions. Use it to connect numerical LDL differences to a plausible biological outcome (plaque formation). Source
For data interpretation, higher LDL is therefore usually treated as less favorable.
The most important exam idea is that cholesterol itself is not simply “good” or “bad.” Its possible health significance depends partly on which lipoprotein is carrying it.
Interpreting cholesterol data
Why total cholesterol can mislead
Total cholesterol combines cholesterol carried in different lipoproteins. On its own, it does not show how much is in HDL and how much is in LDL. This is why a single total cholesterol value can hide important differences between people or groups.
For example:
one person may have high total cholesterol because HDL is high
another may have a similar total cholesterol because LDL is high
the second pattern is usually interpreted as less favorable
When a question provides total cholesterol, HDL, and LDL values, the best approach is to comment on all three rather than judging risk from total cholesterol alone.
Looking separately at LDL and HDL
When interpreting LDL data, focus on whether values are:
higher or lower than another group
increasing or decreasing over time
changing enough to suggest a meaningful biological difference
When interpreting HDL data, ask whether:
HDL rises when LDL falls, which is usually favorable
HDL stays low even if total cholesterol falls
an apparently “better” total cholesterol result is actually due to improved HDL
A person with lower LDL and higher HDL is usually interpreted as having a lower possible cardiovascular risk than a person with higher LDL and lower HDL, even if their total cholesterol values are close.
In time-course data, the most favorable pattern is usually a decrease in LDL together with an increase in HDL. If total cholesterol falls only because HDL falls, that is not necessarily a positive result.
Ratios and useful comparisons
A ratio can sometimes make comparison easier, especially when total cholesterol values are similar.
= concentration of cholesterol in blood, usually in
= concentration of cholesterol carried in HDL, usually in
A lower total:HDL ratio is generally interpreted as more favorable. A higher ratio suggests that HDL makes up a smaller proportion of the total cholesterol, so the profile may be less favorable.
This does not replace direct consideration of LDL. Instead, it adds another way of identifying patterns in the data. In exam questions, ratio data are especially helpful when total cholesterol differs only slightly between individuals.
Comparing group data
Some questions use averages for groups rather than individual results. In these cases:
compare the mean or median values given
note whether HDL and LDL show the same trend as total cholesterol
be cautious if the values are very close together
avoid saying a difference is biologically important unless the data clearly support it
If ranges overlap strongly, the health significance may be less certain than the average values first suggest.
Limits of interpretation
Cholesterol data are useful indicators, but they do not predict exactly what will happen to one person. The key Edexcel wording is possible health significance.
This means:
blood cholesterol results can suggest relative risk
they do not prove that a person has cardiovascular disease
they do not show that a particular outcome is certain
they should be interpreted alongside HDL and LDL, not alone
It is also important to avoid over-claiming. A graph showing lower LDL in one group than another supports the idea of a more favorable cholesterol profile, but it does not by itself prove a complete explanation for differences in health.
Common exam statements
Accurate interpretation often uses cautious language such as:
higher LDL is associated with greater possible cardiovascular risk
higher HDL is associated with a more favorable cholesterol profile
total cholesterol alone is not enough for a full interpretation
a lower total:HDL ratio is generally more desirable
the data suggest an association, not a guaranteed outcome
This wording helps you analyze cholesterol data precisely without claiming more than the data show.
Practice Questions
Explain why a high HDL level may reduce concern about a person’s blood cholesterol result. (2 marks)
HDL carries cholesterol from body tissues back to the liver (1)
therefore a higher HDL level is associated with a more favorable cholesterol profile or lower possible cardiovascular risk (1)
A blood test gives the following results.
Person A: total cholesterol = 6.4 HDL cholesterol = 1.6 LDL cholesterol = 4.0
Person B: total cholesterol = 6.0 HDL cholesterol = 0.9 LDL cholesterol = 4.5
Calculate the total:HDL ratio for each person and use the data to compare the possible health significance of the two results.
(5 marks)
Person A ratio = (1)
Person B ratio = (1)
Person B has lower HDL (1)
Person B has higher LDL (1)
Person B therefore has the less favorable cholesterol profile / greater possible cardiovascular risk; Person A is more favorable despite slightly higher total cholesterol (1)
FAQ
Non-HDL cholesterol means total cholesterol minus HDL cholesterol. It includes LDL and other lipoproteins that can contribute to cholesterol buildup in arteries.
Some clinicians like it because it gives a quick summary of all the cholesterol that is not in HDL, especially when they want something broader than LDL alone.
Not always. Many routine cholesterol tests can be done without fasting, especially when the main focus is total cholesterol and HDL.
However, fasting may still be requested if triglycerides also need to be measured accurately, or if a clinic uses a method that is more reliable after fasting. Always follow the instructions given with the test.
In many labs, LDL is estimated from other blood measurements rather than measured directly. This is quicker and cheaper.
The estimate can become less reliable when triglyceride levels are high, which is one reason some reports look incomplete or request a repeat sample. Direct LDL measurement is used when a more accurate value is needed.
Yes. HDL is usually associated with lower risk, but very high HDL does not always mean extra protection.
What matters is not only how much HDL is present, but also how well it functions. Rare genetic differences, illness, or other metabolic factors can mean a person has high HDL without the expected benefit.
Different countries and labs may report cholesterol in different units. In the UK, results are commonly given in mmol/L, which is equivalent to mmol dm^-3.
Some international sources use mg/dL instead. When comparing data, make sure the units match before deciding whether one result is higher or lower. Mixing units can lead to completely wrong interpretations.