CIE Syllabus focus:
'Analyse and interpret mass spectrometry data to calculate relative atomic mass from isotopic masses and relative abundances, or determine an unknown isotopic abundance from relative atomic mass.'
Mass spectrometry allows chemists to connect isotope peaks with the weighted average mass of an element. The key skill is turning peak data into reliable abundance and relative atomic mass calculations.
Interpreting mass spectrometry data
Mass spectrometry produces a series of peaks for the isotopes of an element.
To answer abundance questions, you must interpret both the position of each peak and its relative size.
In simplified A-Level questions on isotopes, the important information is usually the isotope mass and the relative amount of each isotope. You are not being tested on advanced instrumental detail here; you are being tested on how to use the data quantitatively.
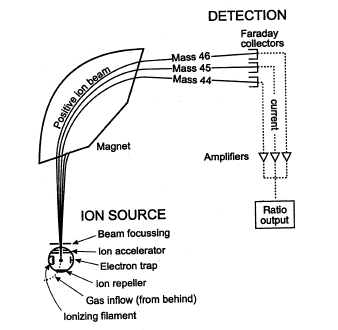
Schematic diagram showing the main stages of a (sector-type) mass spectrometer: ion production, acceleration, separation by deflection in a magnetic field, and detection. The diagram helps connect the idea of different ion paths to different values that appear as separate peaks on a spectrum. Source
What the peaks mean
The m/z value of an isotope peak shows the mass of that isotope in typical exam questions on elemental mass spectra.
The height or area of a peak shows how much of that isotope is present relative to the others.
A larger peak means a greater proportion of that isotope in the sample.
The abundance values may be given as percentages or as relative intensities.
Relative intensities do not have to add up to 100. They can be any consistent ratio.
Isotopic abundance: The proportion of atoms of an element that are present as a particular isotope, usually expressed as a percentage or as a relative peak intensity.
If a spectrum shows three isotope peaks, the element has three isotopes in the sample. The relative atomic mass is not taken from just one peak. It depends on every isotope present and how abundant each one is.
Mass spectra are often normalized. This means the largest peak may be assigned a value such as 100, and the other peaks are scaled relative to it. That still gives usable abundance data because the calculation depends on proportion, not on the absolute size of the numbers.
Calculating relative atomic mass
The relative atomic mass of an element is a weighted mean. This means each isotopic mass contributes according to its abundance. A very common isotope has a much bigger effect on the final value than a rare isotope.
= relative atomic mass, no unit
= isotopic mass
= isotopic abundance, given as a percentage or relative intensity
This expression works whether the abundance data are percentages or any other consistent relative values. If percentages are used, the denominator is usually 100. If relative intensities are used, divide by the total of those intensity values.
A method you can apply
Identify each isotope mass from the spectrum.
Identify the abundance linked to each isotope.
Multiply each isotope mass by its abundance.
Add all of these products together.
Divide by the total abundance.
When the arithmetic is correct, the answer must lie between the smallest and largest isotope masses. It should also be closer to the mass of the most abundant isotope, because that isotope contributes more strongly to the weighted mean.
Percentage data and ratio data
Sometimes exam questions give abundances directly as percentages. In that case, those percentages can be used as they are. There is no need to convert them into decimals unless you do so consistently throughout the whole calculation.
Sometimes abundance is taken from relative peak intensities. These are treated as a ratio. Values such as 50, 25, and 25 represent exactly the same proportions as 2, 1, and 1. Only the relative sizes matter, not the actual magnitude of the numbers.
This is why relative atomic mass is not usually a whole number. It is an average based on the isotopes present, not the mass of one individual atom. If one isotope dominates the sample, the relative atomic mass will be pulled toward that isotope’s mass.
Determining an unknown isotopic abundance
Some questions reverse the process. Instead of calculating relative atomic mass from known abundances, you are given the relative atomic mass and asked to find a missing abundance.
Using algebra
For an element with two isotopes, let one abundance be and the other be if abundances are percentages. Substitute these values into the weighted mean expression, set the result equal to the known relative atomic mass, and solve for .
If the data are given as relative intensities instead of percentages, the same idea still works. The unknown values must add up to the total intensity rather than to 100. The structure of the algebra does not change.
A reliable approach
Write the isotope masses clearly before starting.
Choose a symbol for the unknown abundance.
Use the total abundance to express the other isotope abundance in terms of that symbol.
Substitute into the weighted mean equation.
Solve carefully and then check the answer against the original information.
A valid abundance must be physically sensible. It cannot be negative, and it cannot be greater than the total abundance. Once one abundance has been found, any remaining abundance can be obtained from the total.
Keep extra decimal places during the algebra and round only at the end. Many errors in abundance questions come from early rounding rather than from incorrect chemistry.
Checks and common errors
Do not calculate a simple average of the isotope masses unless the isotopes are equally abundant.
Make sure each abundance is matched to the correct isotope mass.
If percentages are used, divide by 100 unless you have already converted them consistently into fractions.
If relative intensities are used, divide by the total intensity, not automatically by 100.
Check that all isotope abundances add up to the required total.
If the final relative atomic mass falls outside the range of the isotope masses, the setup is wrong.
If an isotope is much more abundant than the others, the final relative atomic mass should be noticeably closer to that isotope’s mass.
In exam questions, careful setup matters more than difficult mathematics. Most mistakes happen because students confuse isotope mass with peak intensity, or forget that the calculation is always a weighted mean.
Practice Questions
An element X has two isotopes, 63 and 65. Their abundances are 69.2% and 30.8% respectively.
Calculate the relative atomic mass of element X.
(2 marks)
Uses a correct weighted mean expression, for example (1)
Correct answer of 63.6 or 63.62 (1)
A sample of element Y contains only two isotopes, 79 and 81. The relative atomic mass of the sample is 79.90.
(a) Determine the percentage abundance of each isotope.
(b) State which isotope gives the taller peak in the mass spectrum.
(5 marks)
Lets one abundance be a variable, for example abundance of isotope 81 = and abundance of isotope 79 = (1)
Sets up a correct equation, for example (1)
Solves correctly to find (1)
Gives abundances as 79 isotope = 55.0% and 81 isotope = 45.0% (1)
States that isotope 79 gives the taller peak (1)
FAQ
Mass numbers are whole numbers because they count protons and neutrons. Actual isotopic masses are measured values, so they are not exact whole numbers.
This happens because nuclear binding energy affects the mass of the nucleus. In exam questions, isotope masses are often rounded to make calculations simpler.
The Periodic Table value is a standard weighted mean based on accepted natural abundances. A question may use rounded isotope masses or simplified abundance values.
Also, a real sample may not have exactly the same isotopic composition as the standard reference sample, especially if it has been enriched or comes from a specific source.
Peak height is easiest to read quickly, but peak area is often more reliable because it represents the full signal for that isotope.
If peaks differ in width or shape, height alone can be misleading. In A-Level questions, the intended abundance data are usually clear, but real instrumental analysis often prefers peak area.
Yes. Natural samples can vary slightly, and some laboratory or industrial samples are deliberately enriched in a particular isotope.
The calculation method does not change. You still use the isotope masses and the abundances for that sample, but the result may differ from the standard relative atomic mass in data books.
First, recheck the equation setup, especially the total abundance and the isotope-abundance pairing.
If the setup is correct, a very small impossible value can come from rounded data. Keep more digits during the calculation and round only at the end. If the error is tiny, report the nearest sensible value.