
IB Syllabus focus:
‘Use tolerant/intolerant indicator species and named biotic indices (e.g., Trent) to infer water quality from community composition and abundance.’
Biological assessment is an essential method for evaluating water quality, using living organisms as indicators. These species reveal pollution levels, ecological stress, and long-term ecosystem health.
Biological Assessment of Water Quality
Biological assessment refers to the use of living organisms to evaluate the health of aquatic ecosystems. Unlike chemical testing, which gives short-term snapshots, biological monitoring provides information on cumulative impacts over time.
Indicator Species
Indicator species are organisms whose presence, absence, or abundance reflects specific environmental conditions. They serve as biological signals of pollution or ecological stress.
Indicator species: Species that reflect particular environmental conditions and are used to infer the quality or characteristics of an ecosystem.
Pollution-tolerant species (e.g., sludge worms, rat-tailed maggots) can survive in highly polluted or oxygen-poor waters.
Pollution-intolerant species (e.g., stonefly larvae, mayfly nymphs) require clean, oxygen-rich water and disappear when pollution levels rise.
The diversity and abundance of these species indicate overall water quality.
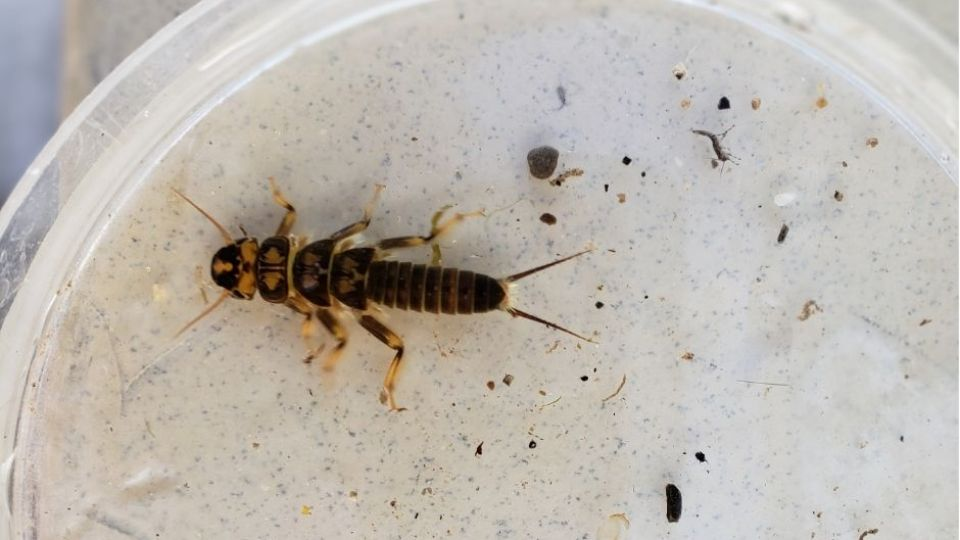
Diagram showing a left-to-right gradient from sensitive (e.g., stonefly, mayfly, caddisfly) to tolerant taxa (e.g., leech, rat-tailed maggot, some snails). Such gradients underpin indicator-based assessments because community shifts signal changing water quality. Labels are simplified to match IB ESS scope. Source.
Biotic Indices
Biotic indices quantify water quality by assessing the types and numbers of organisms present. Each species is assigned a value based on its tolerance to pollution.
Biotic index: A numerical scale that relates the presence of organisms in a sample to the level of organic pollution in the water.
Key features of biotic indices:
Score systems rank organisms by tolerance.
Higher scores indicate cleaner water; lower scores suggest pollution.
Widely used in environmental monitoring due to their reliability.
The Trent Biotic Index
One widely used system is the Trent Biotic Index, developed in the UK to assess river water quality.
Organisms are classified into groups based on tolerance.
Each group receives a score reflecting pollution sensitivity.
Total scores across groups yield an overall water quality rating.
Process:
Collect a water sample containing invertebrates.
Identify organisms to taxonomic groups.
Assign tolerance scores.
Calculate overall index value.
The Trent system is particularly effective because it combines community composition with abundance data, giving a more nuanced picture than presence/absence alone.
Community Composition and Abundance
The structure of aquatic communities—types of organisms and their population sizes—provides important insights into water quality.
High biodiversity with many pollution-sensitive species reflects clean, stable environments.
Dominance of tolerant species indicates pollution stress and declining oxygen levels.
Intermediate conditions may show a mix of tolerant and intolerant species, reflecting transitional stress.
Advantages of Biological Assessment
Long-term monitoring: Detects cumulative effects of pollution over time.
Cost-effective: Less reliance on expensive chemical equipment.
Ecosystem relevance: Measures actual biological impact, not just chemical presence.
Public involvement: Simple methods allow participation through citizen science initiatives.
Limitations of Biological Assessment
While powerful, biological methods also have weaknesses:
Time lag: Organisms may respond slowly to sudden changes, missing short-term events.
Habitat dependence: Results vary depending on natural conditions (e.g., fast-flowing vs. stagnant water).
Taxonomic skill: Accurate identification requires expertise, especially for small invertebrates.
Local differences: Biotic indices may need adaptation for regional species and climates.
Comparison with Abiotic Measures
Abiotic tests (e.g., dissolved oxygen, pH, nutrients) provide immediate chemical readings.
Biological assessments reveal long-term ecological consequences.
Both methods are complementary and often used together to gain full insight into water quality.
Key Biological Groups Used in Assessment
Insects: Stoneflies, mayflies, caddisflies (intolerant); midges and worms (tolerant).
Crustaceans: Freshwater shrimps and amphipods, sensitive to low oxygen.
Molluscs: Snails and mussels, variable tolerance depending on species.
Algae: Sensitive to nutrient levels; some species thrive under eutrophic conditions.
Practical Application in Environmental Systems and Societies
In IB Environmental Systems and Societies SL, understanding biological assessment means:
Recognising key tolerant and intolerant species.
Applying named indices like the Trent Biotic Index.
Relating community composition and abundance to pollution and water quality.
Evaluating strengths and limitations of biological monitoring methods.
Practice Questions
Question 1 (2 marks)
Define the term indicator species and give one example of a pollution-intolerant species used in water quality assessment.
Mark Scheme
Definition of indicator species: Species whose presence, absence, or abundance reflects specific environmental conditions or pollution levels. (1 mark)
Example of a pollution-intolerant species, e.g. stonefly larvae or mayfly nymphs. (1 mark)
Question 2 (5 marks)
Explain how biotic indices, such as the Trent Biotic Index, use community composition and abundance to assess water quality. Include both strengths and limitations in your answer.
Mark Scheme
Description of how biotic indices work: species are assigned tolerance values and scores are calculated based on presence/abundance. (1 mark)
Reference to use of community composition (diversity and types of organisms). (1 mark)
Reference to abundance (relative population sizes inform water quality). (1 mark)
At least one strength, e.g. long-term indication, cost-effective, reflects biological impact. (1 mark)
At least one limitation, e.g. need for taxonomic skill, habitat differences, time lag in response. (1 mark)
FAQ
Macroinvertebrates are widely used because they are relatively easy to collect, abundant in most freshwater habitats, and have varying tolerance levels to pollution.
They also have limited mobility, meaning they reflect local water conditions rather than broad regional trends. Their life cycles often last months to years, making them effective indicators of long-term environmental quality.
The Trent Biotic Index specifically combines both presence/absence and abundance data of macroinvertebrates to calculate a score, whereas many simpler indices rely only on presence or absence.
This dual approach allows the Trent index to provide a more nuanced picture of pollution effects, reducing the chance of misinterpretation when only a few tolerant or intolerant species are present.
Chemical tests only provide a snapshot of water quality at the time of sampling.
Community composition reveals the cumulative effects of pollution over time, since organisms respond to long-term conditions.
Sensitive species disappearing indicates prolonged stress.
Dominance of tolerant species highlights persistent low oxygen or contamination.
Indices developed in Europe are based on regional species. Using them elsewhere can produce inaccurate results because local species may have different pollution tolerances.
In other regions, modified or newly developed indices are necessary. For example, North America has the Hilsenhoff Biotic Index, while other countries have adapted tools to their native fauna.
Yes. Citizen science often involves volunteers sampling macroinvertebrates and applying simplified tolerance-based keys.
Benefits include:
Expanding monitoring coverage at low cost.
Raising public awareness of water quality issues.
Providing baseline data for scientists and policymakers.
However, professional verification is often required to ensure accuracy, especially for species-level identifications.
