
IB Syllabus focus:
‘Nutrient inputs (fertilisers, sewage, detergents) trigger blooms, then decomposition, oxygen depletion and die-offs; warming and stratification increase hypoxia/anoxia and dead zones.’
Eutrophication is a critical environmental issue that disrupts freshwater and marine ecosystems. It arises when excessive nutrients enter water bodies, setting off damaging biological and chemical processes.
Causes of Eutrophication
Nutrient Inputs
The primary driver of eutrophication is an oversupply of nutrients, especially nitrogen (N) and phosphorus (P). These nutrients often originate from human activities:
Agricultural fertilisers: Runoff from cropland delivers high concentrations of nitrogen and phosphorus.
Sewage effluent: Untreated or poorly treated wastewater contributes organic matter and nutrients.
Detergents: Certain synthetic detergents contain phosphate additives that intensify nutrient loads.
Nutrient loading: The process by which nutrients, especially nitrogen and phosphorus, are introduced into an ecosystem in greater amounts than it can naturally process.
Natural nutrient inputs also occur through weathering of rocks and atmospheric deposition, but human activity accelerates the process far beyond ecological balance.
Climatic and Physical Factors
Warming of water bodies increases biological activity and algal growth.
Stratification of water (layering due to temperature differences) prevents vertical mixing, trapping nutrients in surface layers.
Reduced water flow in rivers, lakes, and estuaries can concentrate pollutants and exacerbate eutrophication.
Sequence of Eutrophication
Step 1: Algal Blooms
When nutrient concentrations rise, algal blooms rapidly occur. These are dense populations of phytoplankton or cyanobacteria that cloud the water surface.
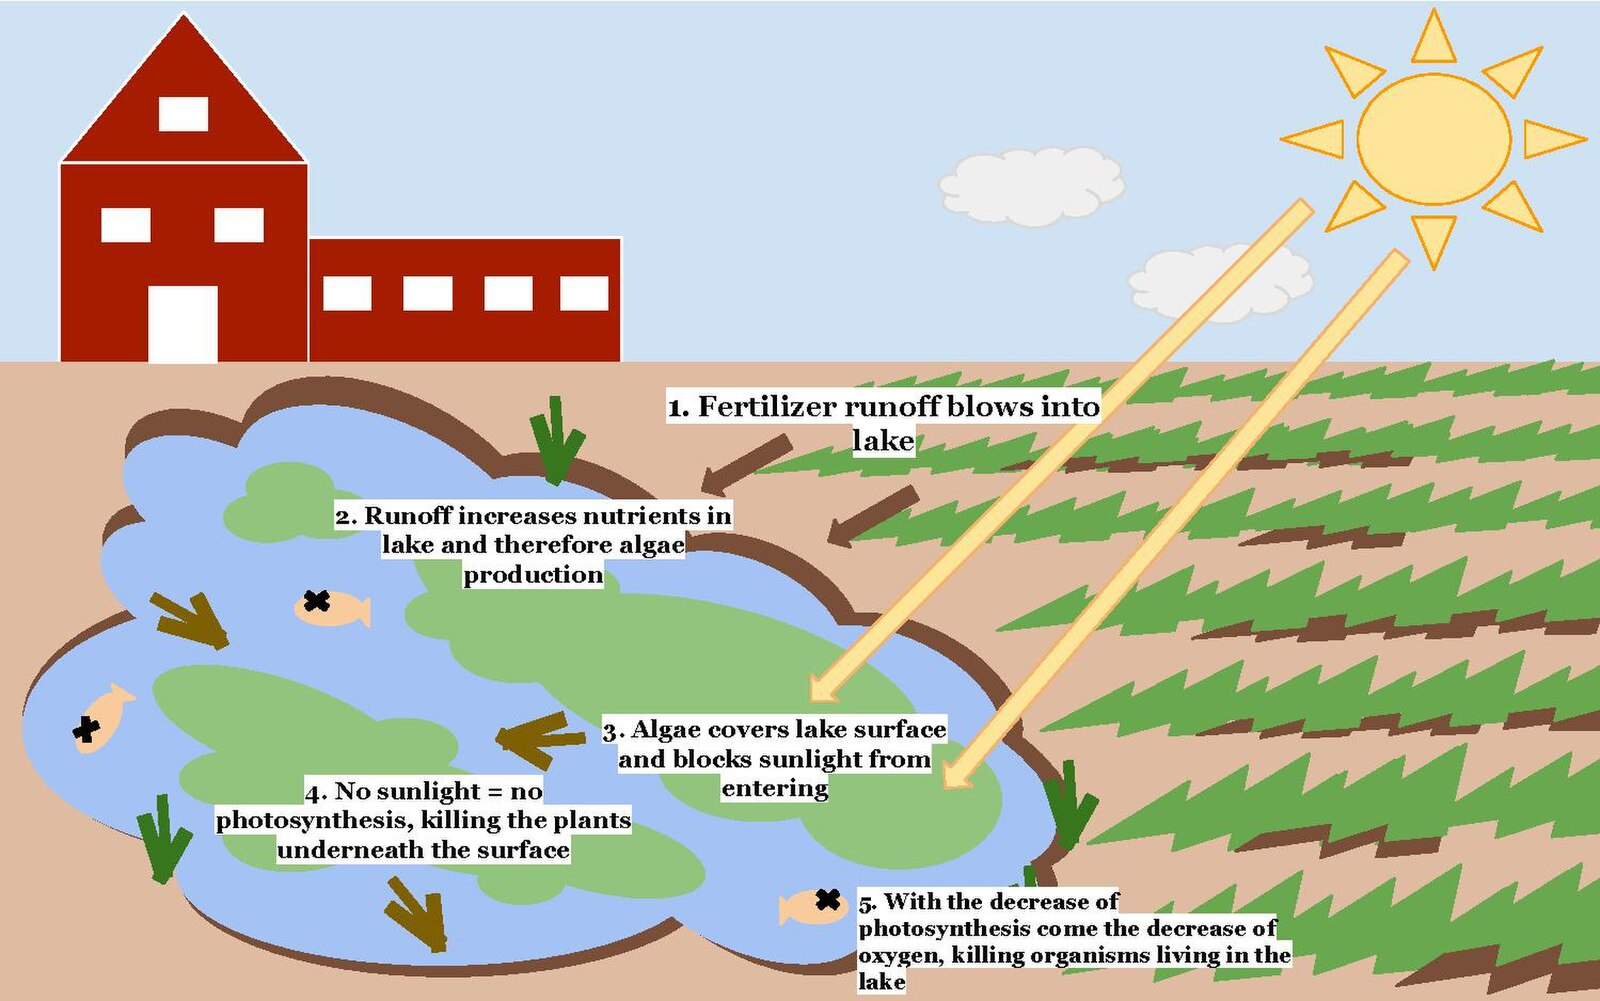
Labelled schematic showing nutrient runoff stimulating algal blooms, reducing light to submerged plants, and driving oxygen depletion that causes aquatic die-offs. The diagram mirrors the IB-required sequence from inputs to hypoxia/anoxia. Clean labels keep the focus on processes rather than percentages. Source.
Algal bloom: A rapid increase or accumulation of algae in a water system, usually caused by nutrient enrichment.
Algal blooms block sunlight from reaching submerged plants, reducing photosynthesis and threatening aquatic biodiversity.
Step 2: Decomposition of Biomass
As algae die, they settle to the bottom where decomposer microorganisms break them down. This process consumes dissolved oxygen (DO) in the water.
Increased biomass of algae → Higher microbial respiration.
Organic matter accumulation leads to rapid depletion of oxygen levels.
Step 3: Oxygen Depletion
With high microbial activity, dissolved oxygen drops sharply, especially in deeper waters. This condition is known as hypoxia when oxygen levels are low, or anoxia when oxygen is absent.
Hypoxia: A condition in which dissolved oxygen levels are reduced below levels necessary to sustain most aquatic life (commonly <2 mg/L).
Species sensitive to oxygen stress, such as fish and invertebrates, either migrate or die. Sessile organisms (e.g., shellfish) are particularly vulnerable.
Step 4: Biological Die-offs
Oxygen depletion triggers die-offs of aquatic organisms. Fish kills are highly visible indicators, but entire food webs are affected.
Fish, crustaceans, and molluscs die in large numbers.
Aquatic vegetation declines due to reduced light and oxygen availability.
Biodiversity is reduced as tolerant species dominate while sensitive species vanish.
Step 5: Dead Zones
Persistent eutrophication results in the creation of dead zones, areas with little to no oxygen where few organisms can survive.
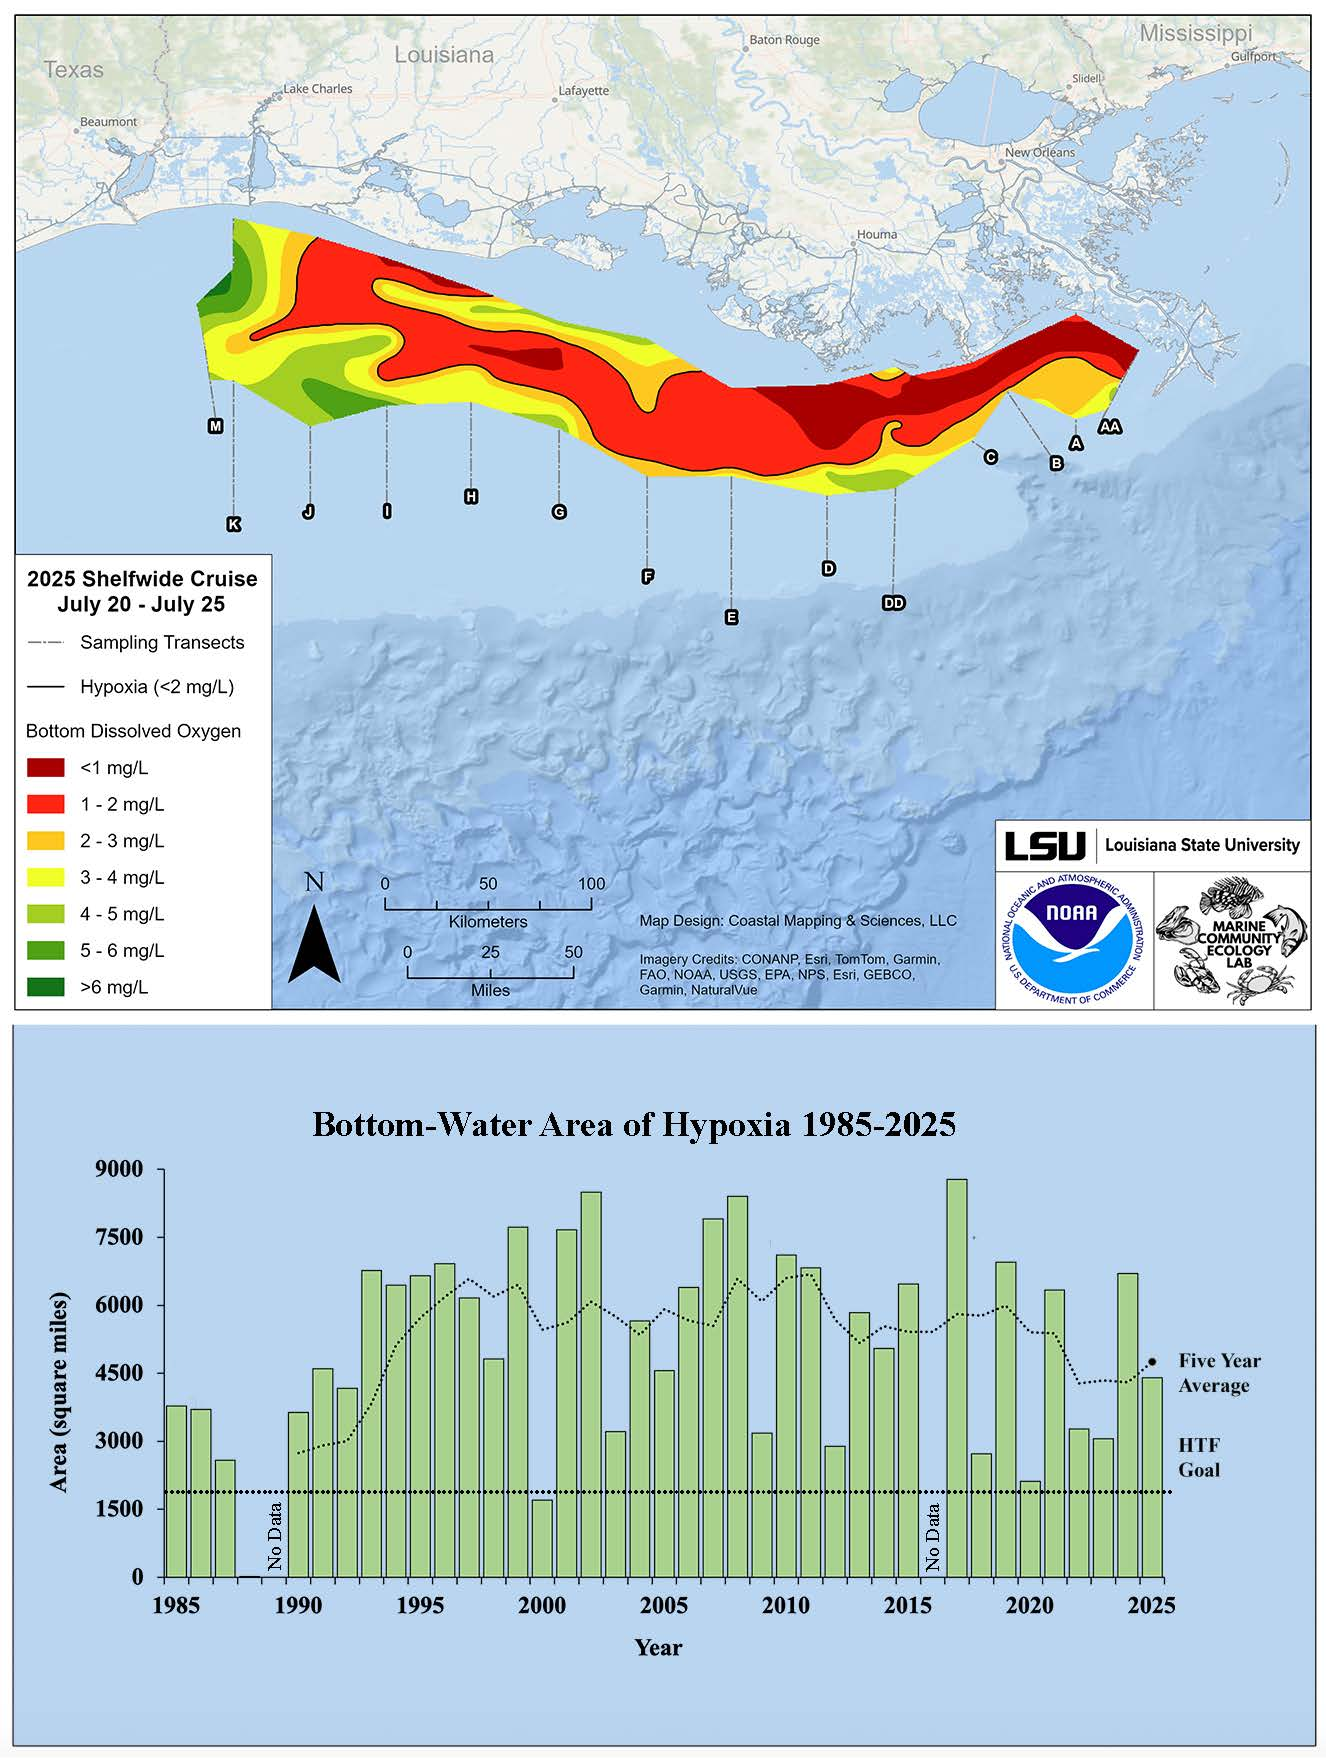
Map of the northern Gulf of Mexico showing the seasonal hypoxic “dead zone” (≤2 mg L⁻¹ dissolved oxygen), a downstream consequence of nutrient-driven eutrophication and stratification. The lower panel displays annual area estimates, which exceed syllabus scope but help convey scale. Source.
Dead zone: An area in aquatic ecosystems where oxygen levels are too low to support most marine life, often caused by nutrient pollution and eutrophication.
Dead zones are most common in estuaries and coastal seas influenced by agricultural runoff and urban wastewater. Famous examples include the Gulf of Mexico and the Baltic Sea.
Amplifying Factors
Thermal Stratification
Warm surface layers prevent oxygen-rich water mixing downward.
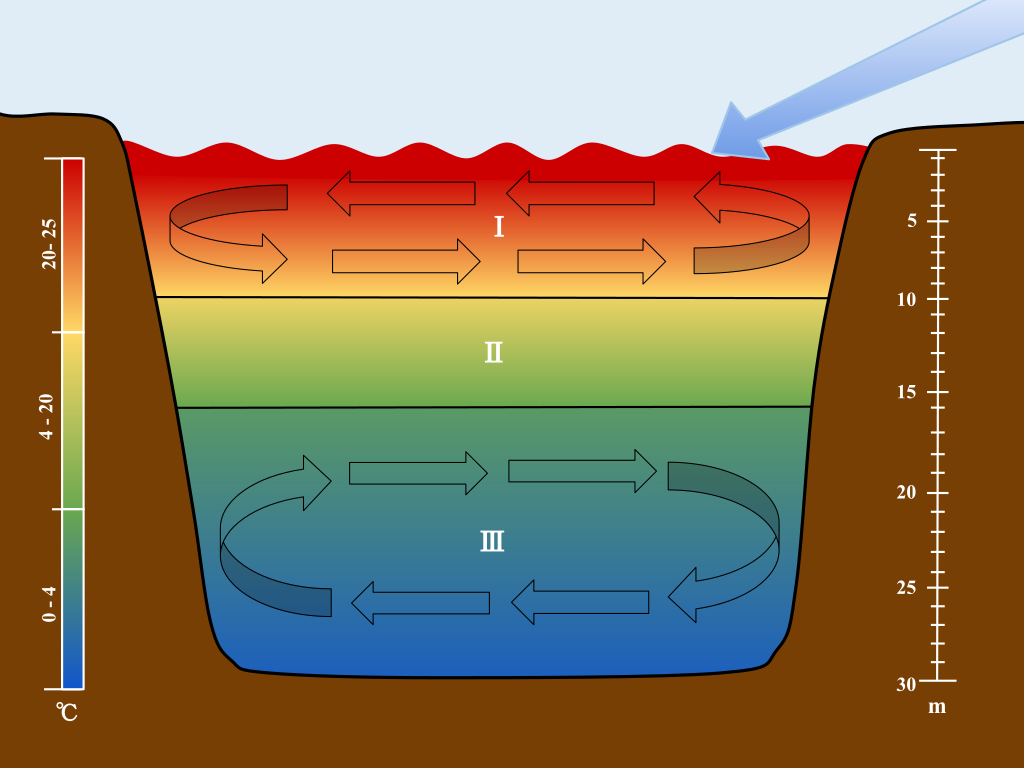
A cross-section of a stratified lake depicts the epilimnion, metalimnion (thermocline), and hypolimnion, clarifying how layering restricts oxygen replenishment at depth during eutrophication. The temperature and depth scales exceed the syllabus detail but help visualise why stratification sustains hypoxia. Source.
Deeper waters remain oxygen-poor, worsening hypoxia.
Climate Change
Climate change exacerbates eutrophication by:
Increasing water temperatures, which speed up algal metabolism.
Intensifying rainfall events, leading to nutrient-rich runoff.
Prolonging droughts, concentrating nutrients in stagnant waters.
Positive Feedback Loops
Anoxic sediments can release phosphorus back into the water column.
This recycling fuels further algal blooms, making recovery difficult.
Ecological and System-Level Impacts
Disruption of Ecosystem Services
Eutrophication undermines water quality and ecosystem services:
Drinking water supplies become contaminated by algal toxins.
Fisheries collapse due to loss of harvestable species.
Recreational uses of water (boating, swimming) decline because of foul odours and scums.
Shifts in Community Structure
Dominance shifts to tolerant organisms such as cyanobacteria, some of which produce harmful toxins.
Decline in sensitive species reduces ecosystem resilience.
Food webs destabilise as primary producers no longer support higher trophic levels effectively.
Key Processes to Remember
Nutrient enrichment → fertilisers, sewage, detergents.
Algal blooms → rapid algal growth reduces light penetration.
Decomposition → dead biomass fuels microbial activity.
Oxygen depletion → hypoxia and anoxia in deeper waters.
Die-offs → collapse of aquatic life.
Dead zones → long-term oxygen-starved regions.
Practice Questions
Question 1 (2 marks)
Identify two human activities that contribute to eutrophication and briefly explain how each introduces nutrients into aquatic systems.
Mark scheme:
Agricultural fertiliser use/runoff (1 mark) – explanation: contains nitrogen and phosphorus that wash into water bodies (1 mark).
Sewage discharge (1 mark) – explanation: untreated or poorly treated wastewater adds organic matter and nutrients such as nitrogen and phosphorus (1 mark).
Detergent use (1 mark) – explanation: phosphates in detergents increase nutrient loads (1 mark).
Maximum of 2 marks awarded. Students can choose any two valid examples with brief explanations.
Question 2 (5 marks)
Describe the sequence of events that occurs during eutrophication, from nutrient enrichment to the formation of dead zones.
Mark scheme:
Nutrient enrichment (1 mark) – excess nitrogen and/or phosphorus enter the water from sources such as fertilisers, sewage, or detergents.
Algal blooms (1 mark) – rapid growth of algae or cyanobacteria forms dense surface layers, blocking light penetration.
Plant death/reduced photosynthesis (1 mark) – submerged plants die due to lack of light.
Decomposition and oxygen depletion (1 mark) – dead biomass decomposed by microorganisms, consuming dissolved oxygen.
Hypoxia/anoxia leading to die-offs/dead zones (1 mark) – low or no oxygen results in mass mortality of aquatic organisms and creation of oxygen-starved zones.
Maximum of 5 marks awarded. Responses must show clear sequential order to gain full credit.
FAQ
Cyanobacteria often dominate algal blooms because they thrive in nutrient-rich, warm waters. Some species fix atmospheric nitrogen, giving them a competitive edge when phosphorus is abundant but nitrogen is limited.
Many cyanobacteria produce toxins, such as microcystins, which can harm fish, livestock, and humans. Their resilience and toxin production make them particularly problematic during eutrophication events.
During daylight, algae photosynthesise and release oxygen into the water. At night, photosynthesis stops but respiration by algae and decomposers continues.
This oxygen consumption at night intensifies hypoxia, especially when algal biomass is high. As a result, oxygen levels often reach their lowest point just before sunrise.
Lakes: Nutrient inputs are often localised from fertiliser runoff or sewage, leading to clear algal bloom cycles. Stratification is common in summer, worsening oxygen depletion at depth.
Coastal areas: Nutrient enrichment is usually from rivers carrying agricultural runoff. The scale is larger, with seasonal “dead zones” forming where rivers meet the sea, such as in estuaries.
Yes, but it happens much more slowly. Natural eutrophication occurs as lakes age and accumulate nutrients from soil erosion and decaying organic matter.
This gradual process can take centuries. Human activities accelerate it dramatically, leading to cultural eutrophication, which can develop in just years or decades.
Eutrophication often triggers HABs, which are algal blooms dominated by toxin-producing species.
These toxins can accumulate in shellfish and fish, causing health risks when consumed by humans. HABs also disrupt fisheries, tourism, and water supplies, making them a major socio-economic concern linked to nutrient enrichment.

.svg)